Introduction
Today we were challenged to use an output device that we have never used before. By the end of the lesson we were supposed to be familiar with how to operate output devices as well as with the different kinds of output devices.
In today's lesson, we learned about closed-loop output devices. These output devices have sensors to ensure that their output is precise (such as a servo motor). I wanted to try building a closed-loop output device of my own, and settled on a closed loop heating pad.
Components
This project required just 1 component: the closed-loop heating pad.
Part 1 - Closed-Loop Heating Pad
For my heating pad I decided to include a thermistor such that the Arduino could turn the pad off an on at intervals to maintain a somewhat steady temperature. This will help me become more familiar with closed-loop technology, which I imagine will be critical for my final project. First, I found a heating pad and a 12 volt power supply to operate it with.
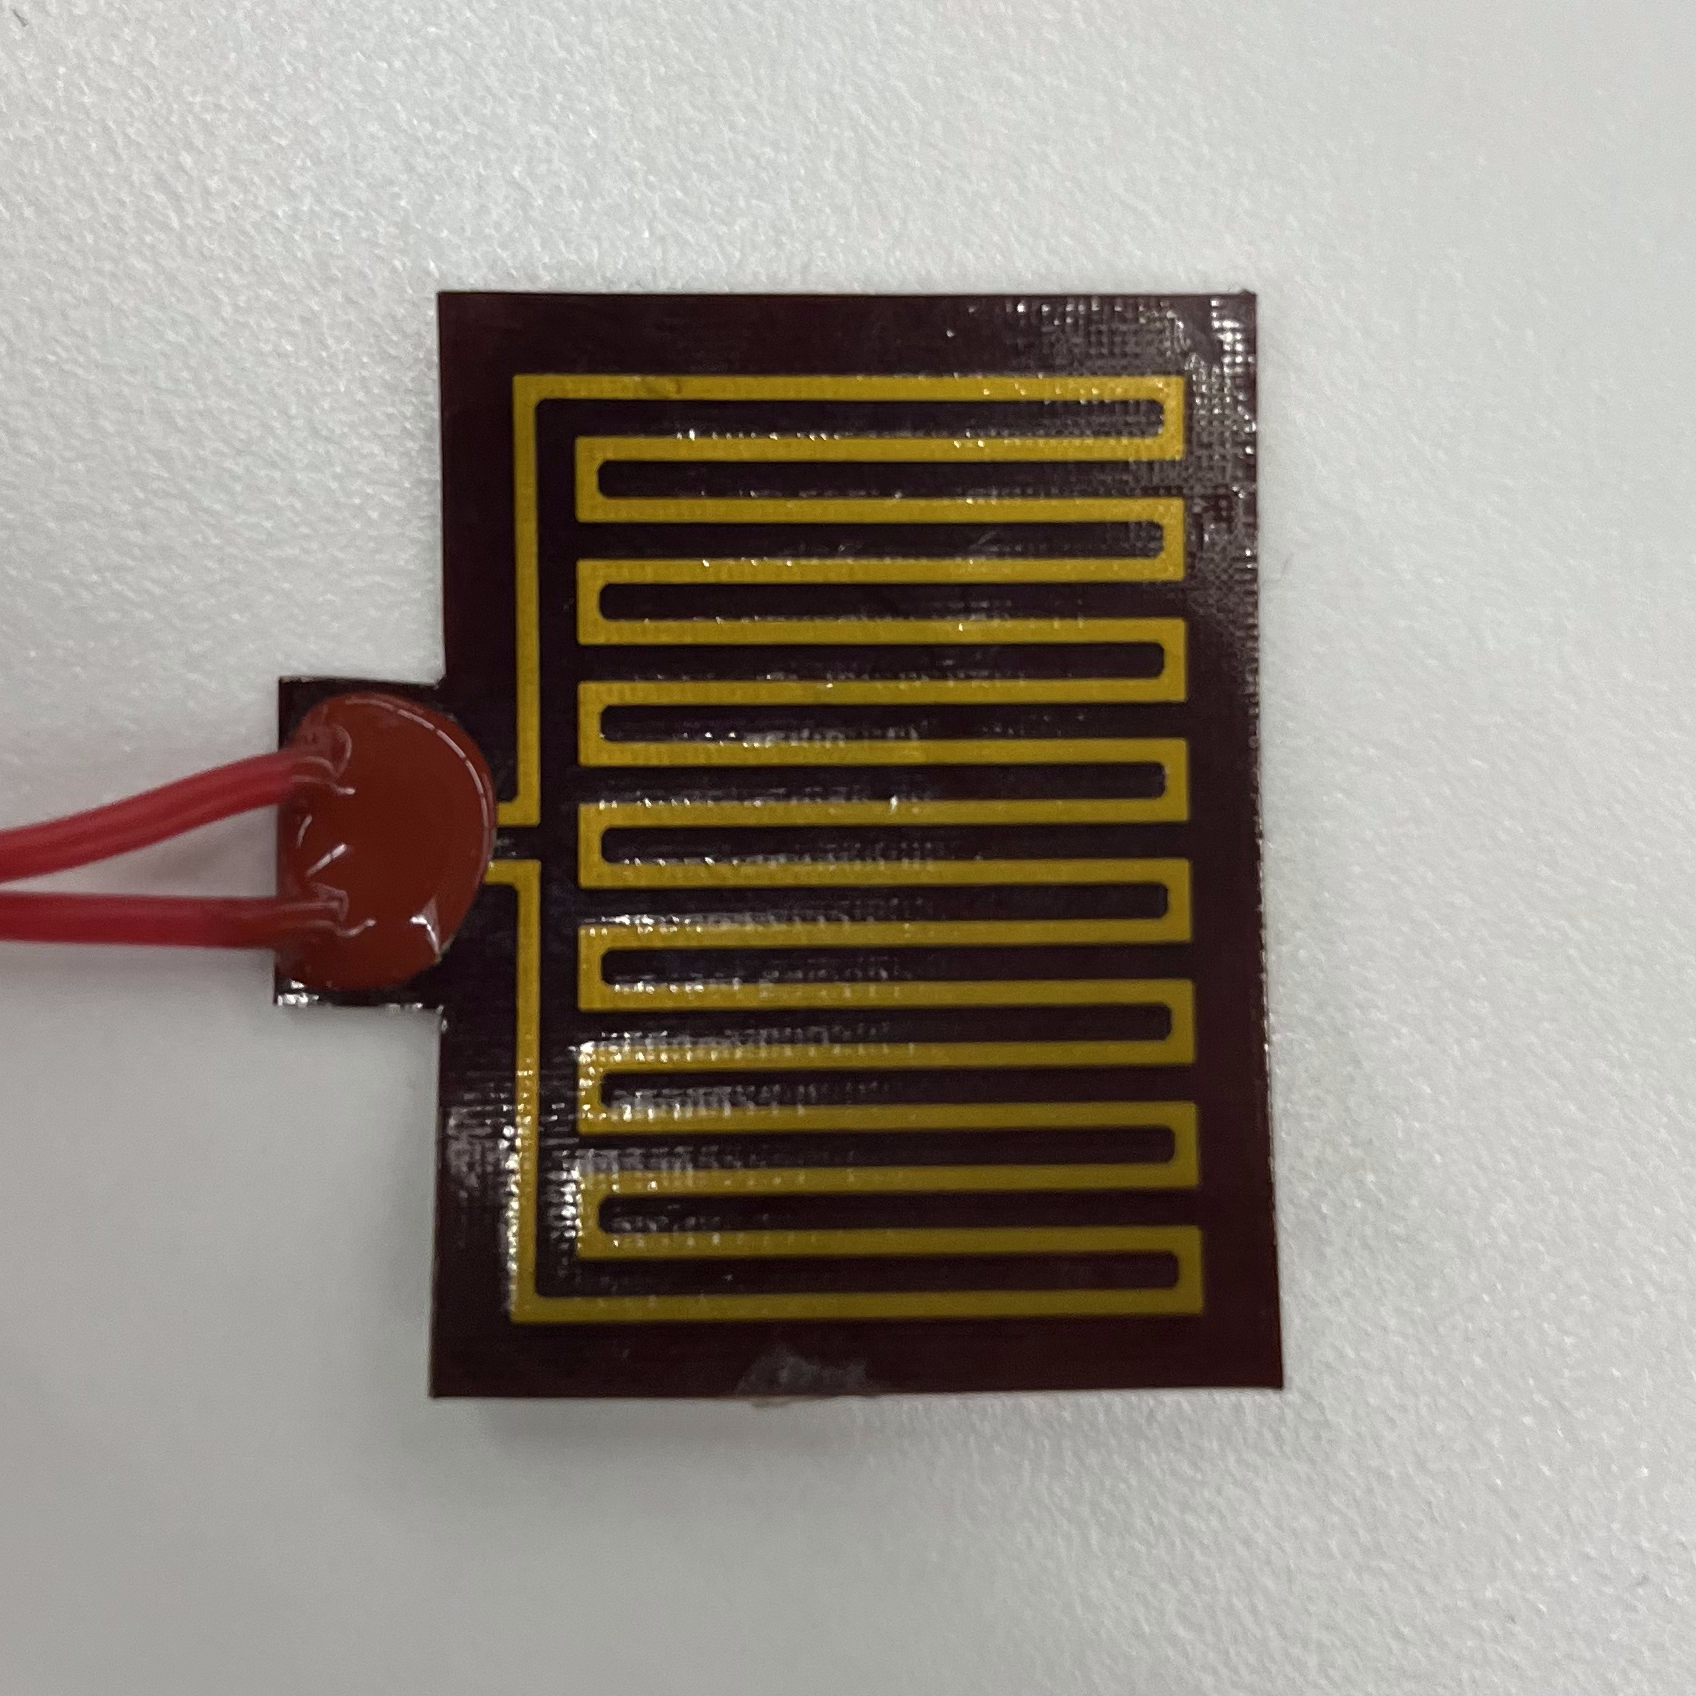
Fig 1. Heating pad
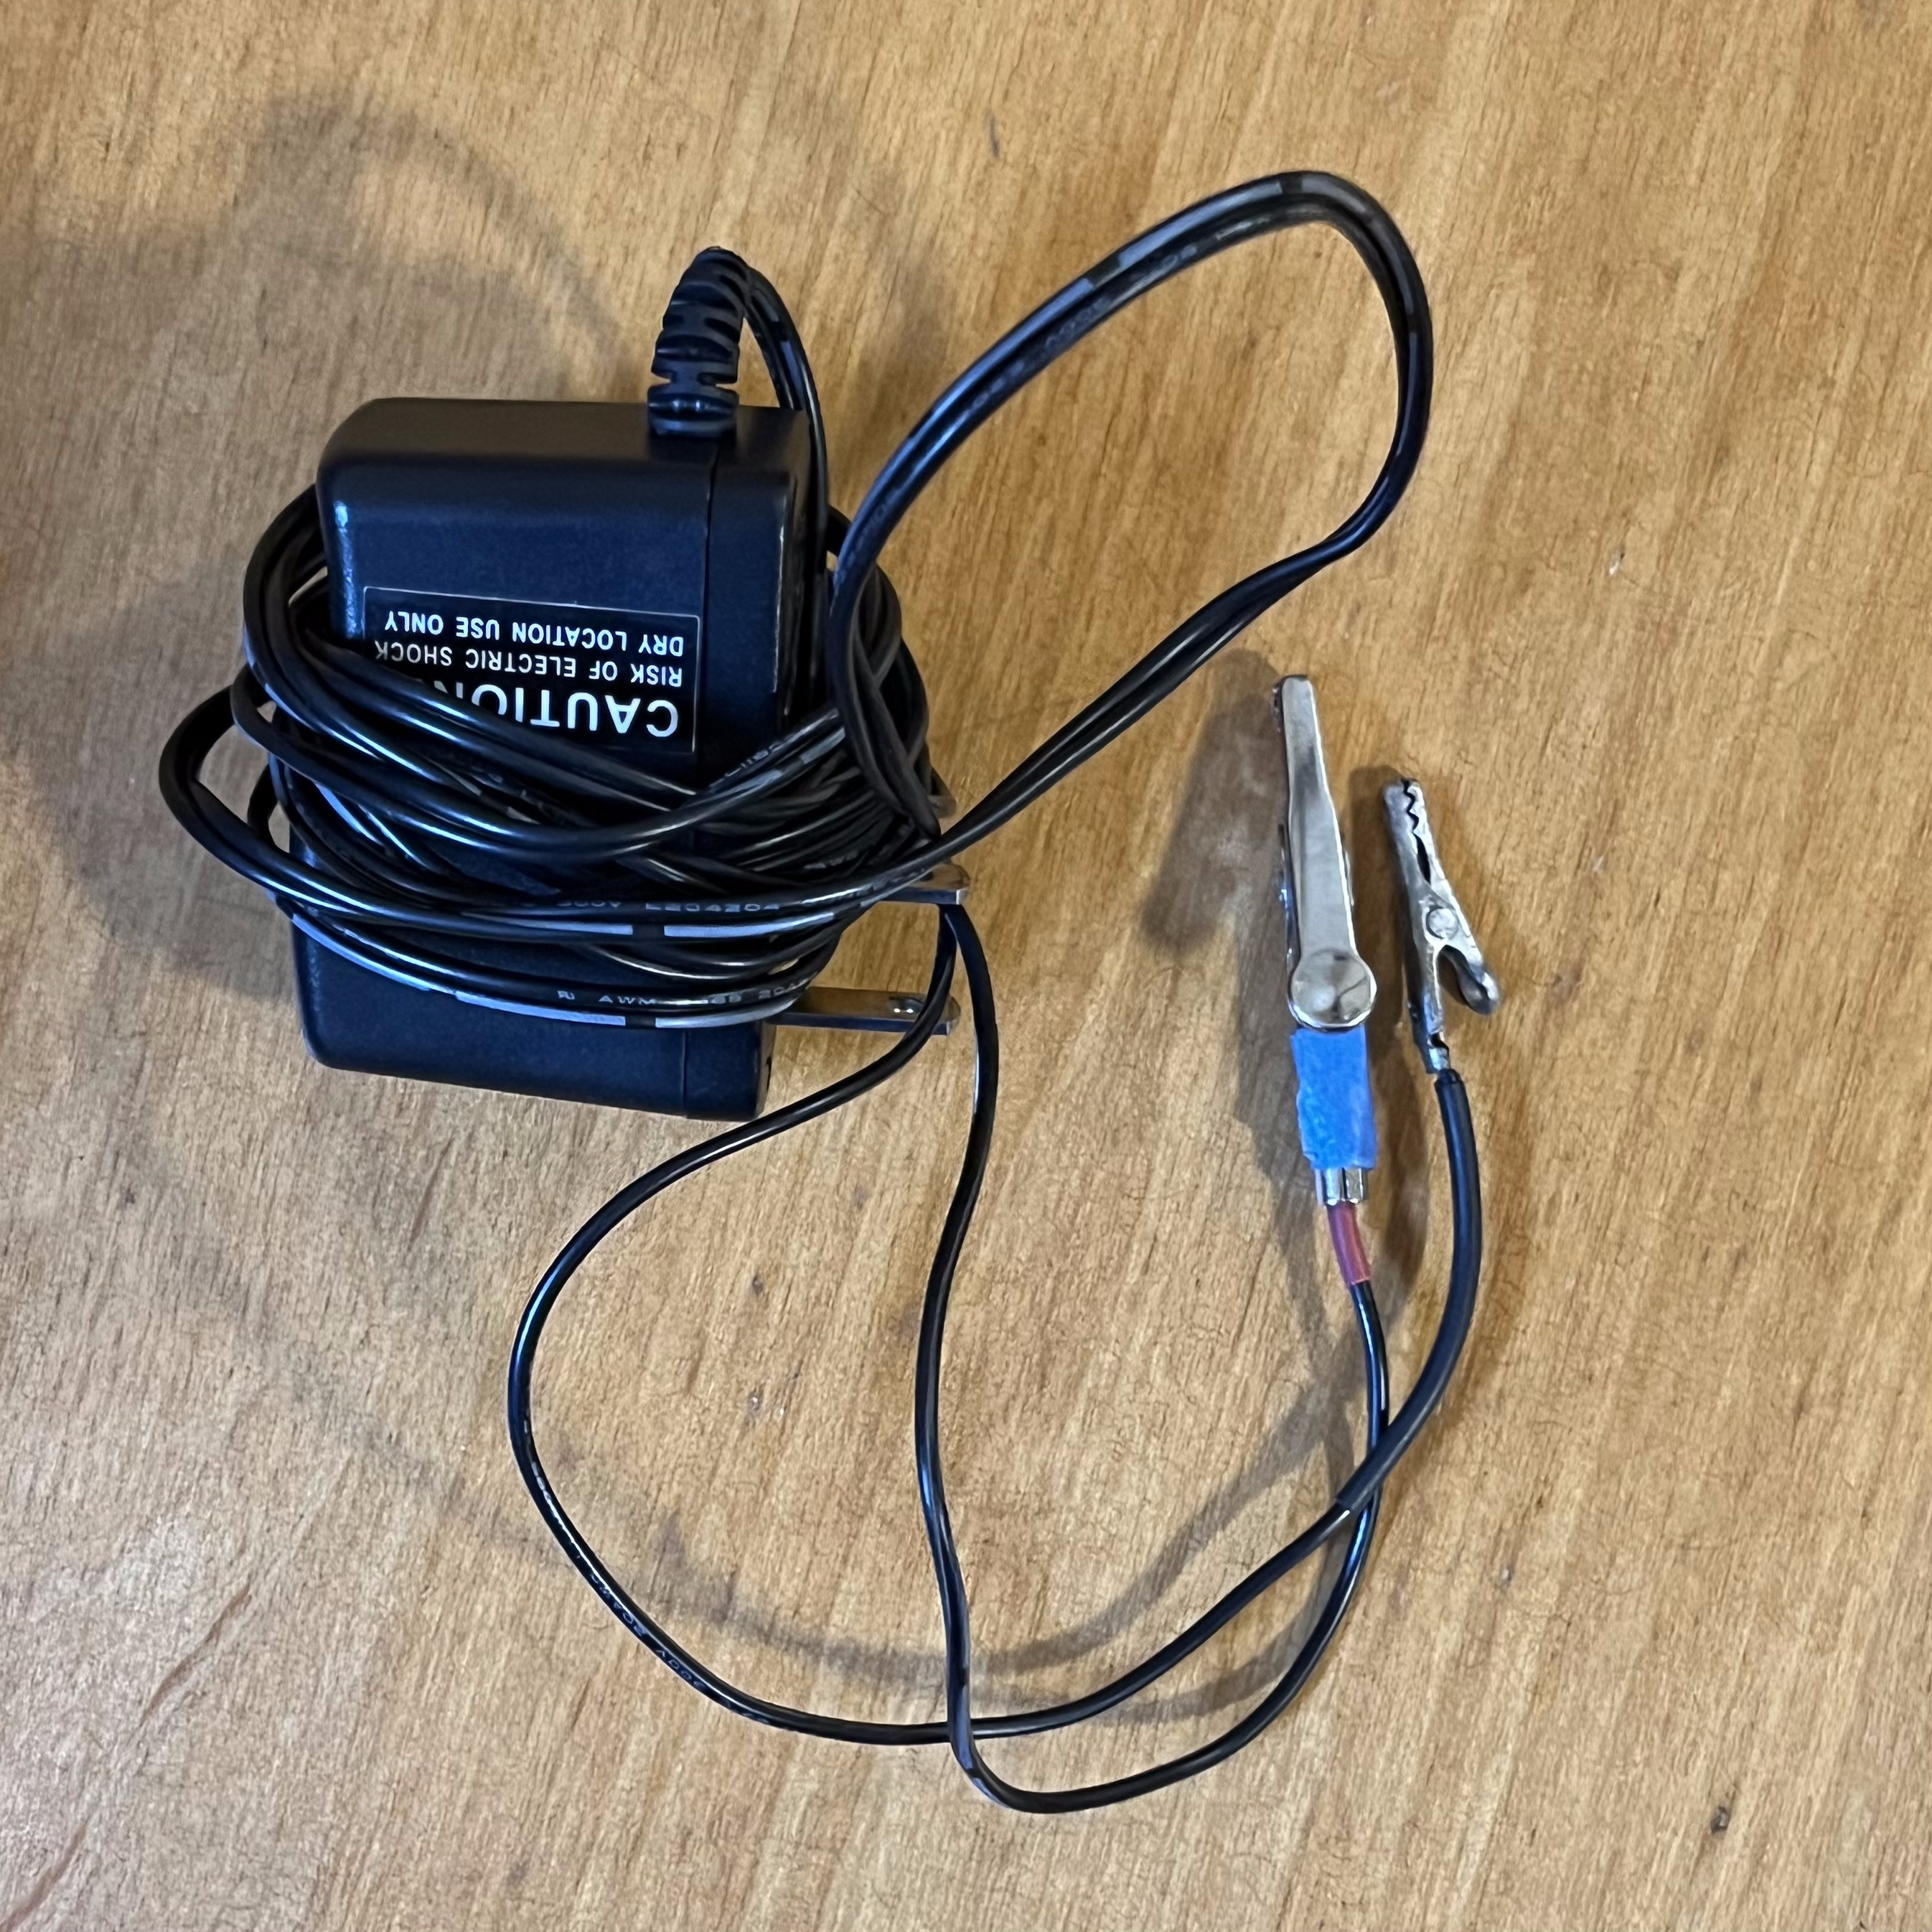
Fig 2. 12v power supply
Next, I tried wiring the power supply and heating pad to a L9110 H Bridge, with no success. After trying to troublshoot this for a while, I asked Bobby and Ibrahim about the problem which led me to use the SRD-12VDC 1-channel relay instead. I started by connecting ground, 5v, and an output pin to the relay.
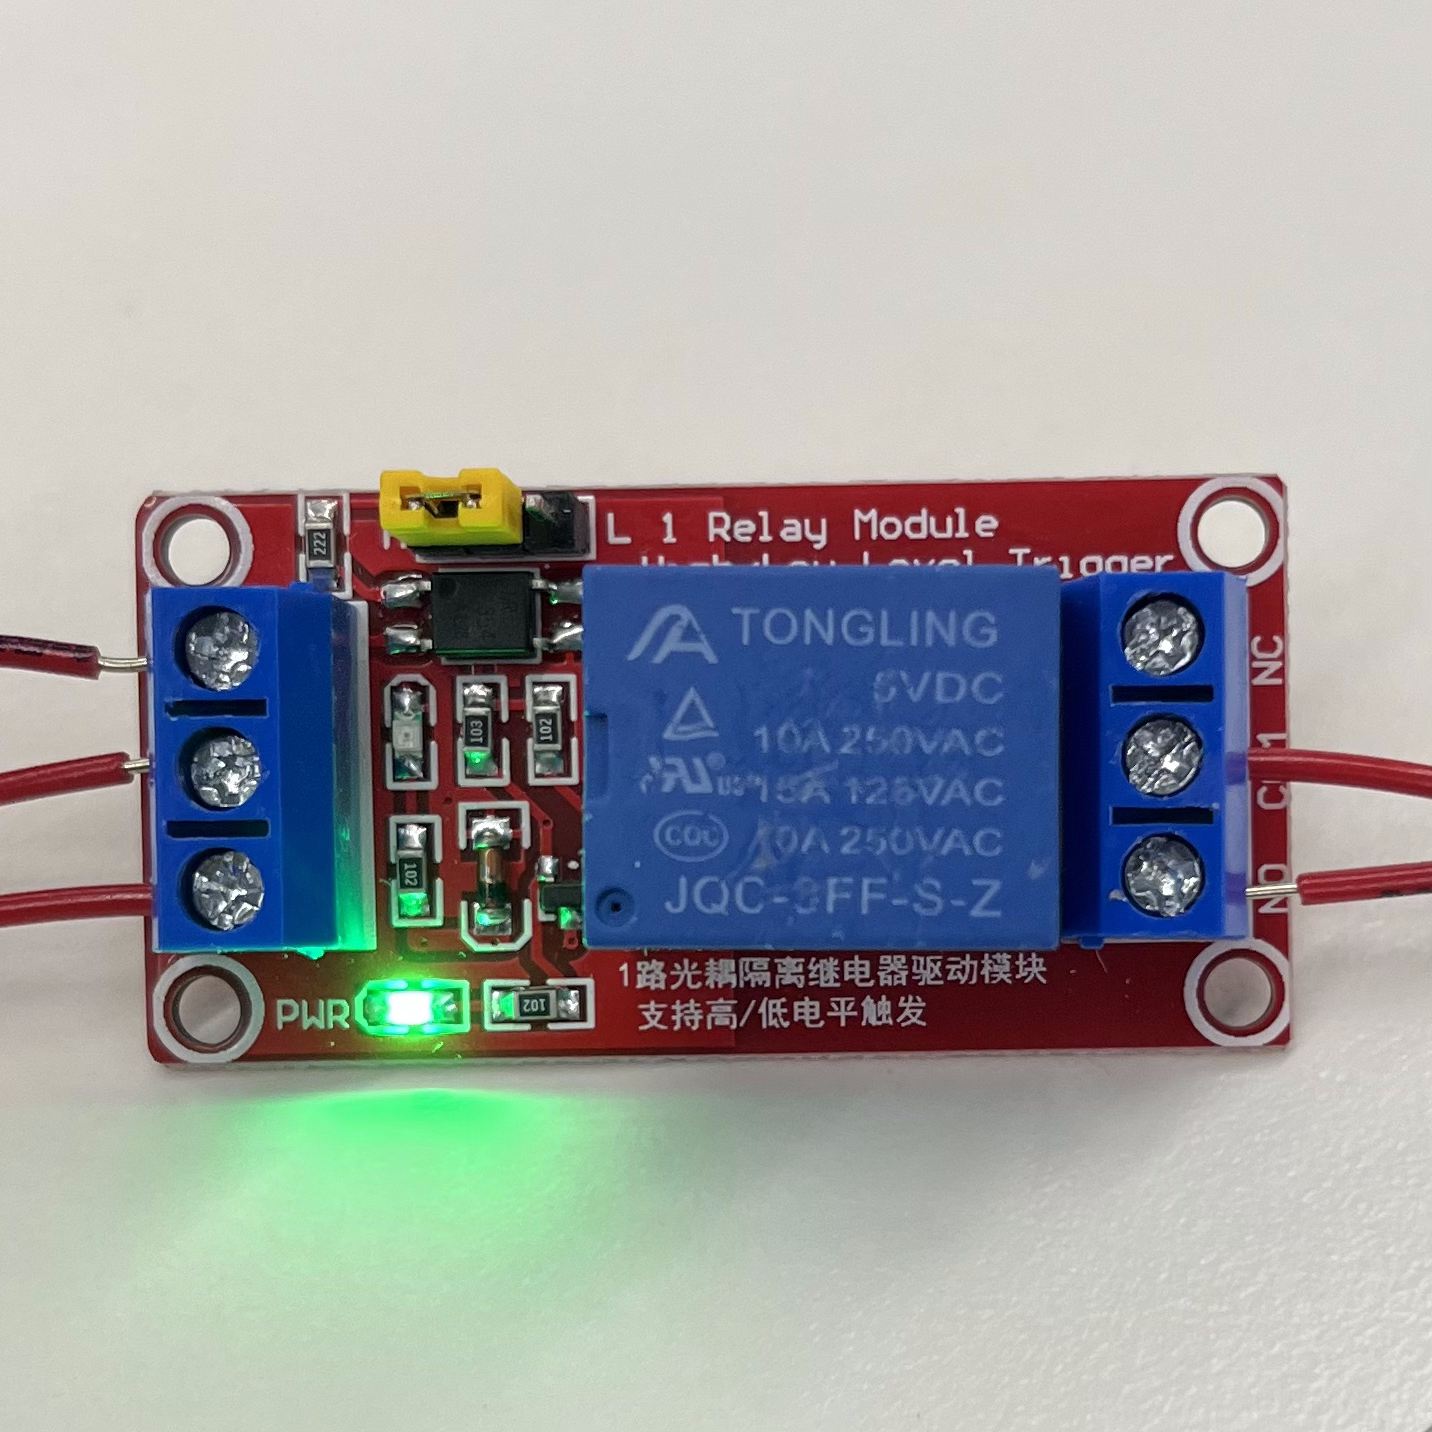
Fig 3. SRD-12VDC relay
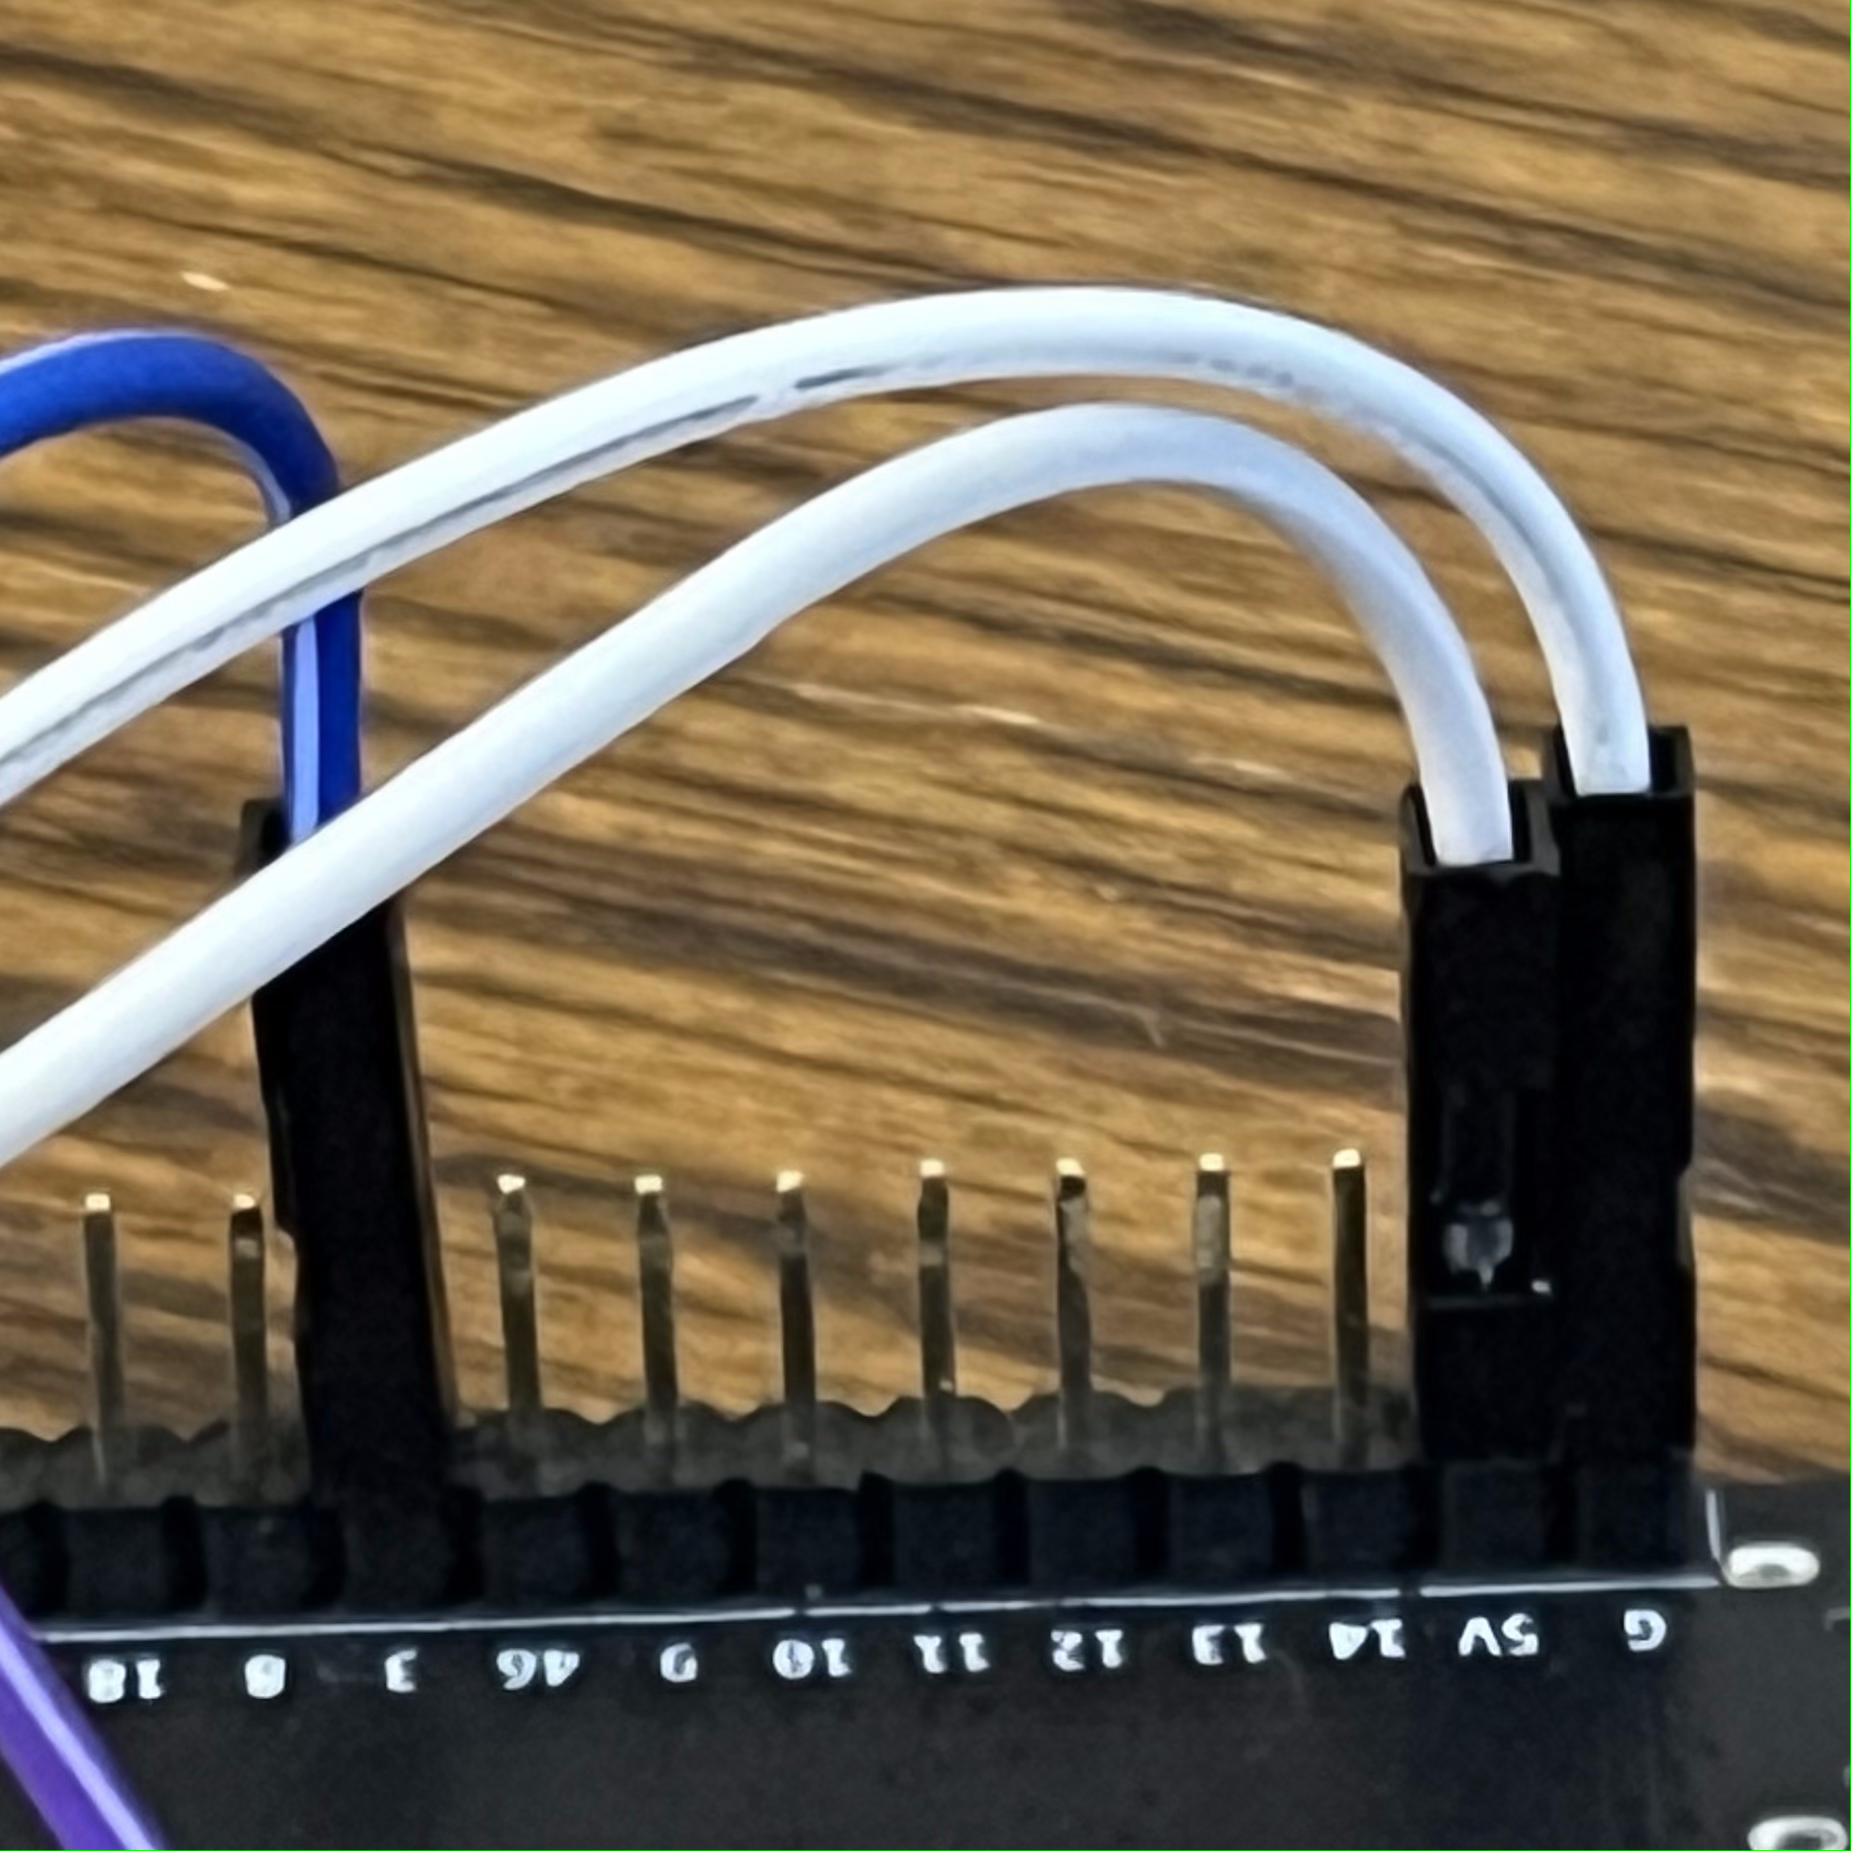
Fig 5. Arduino input connection
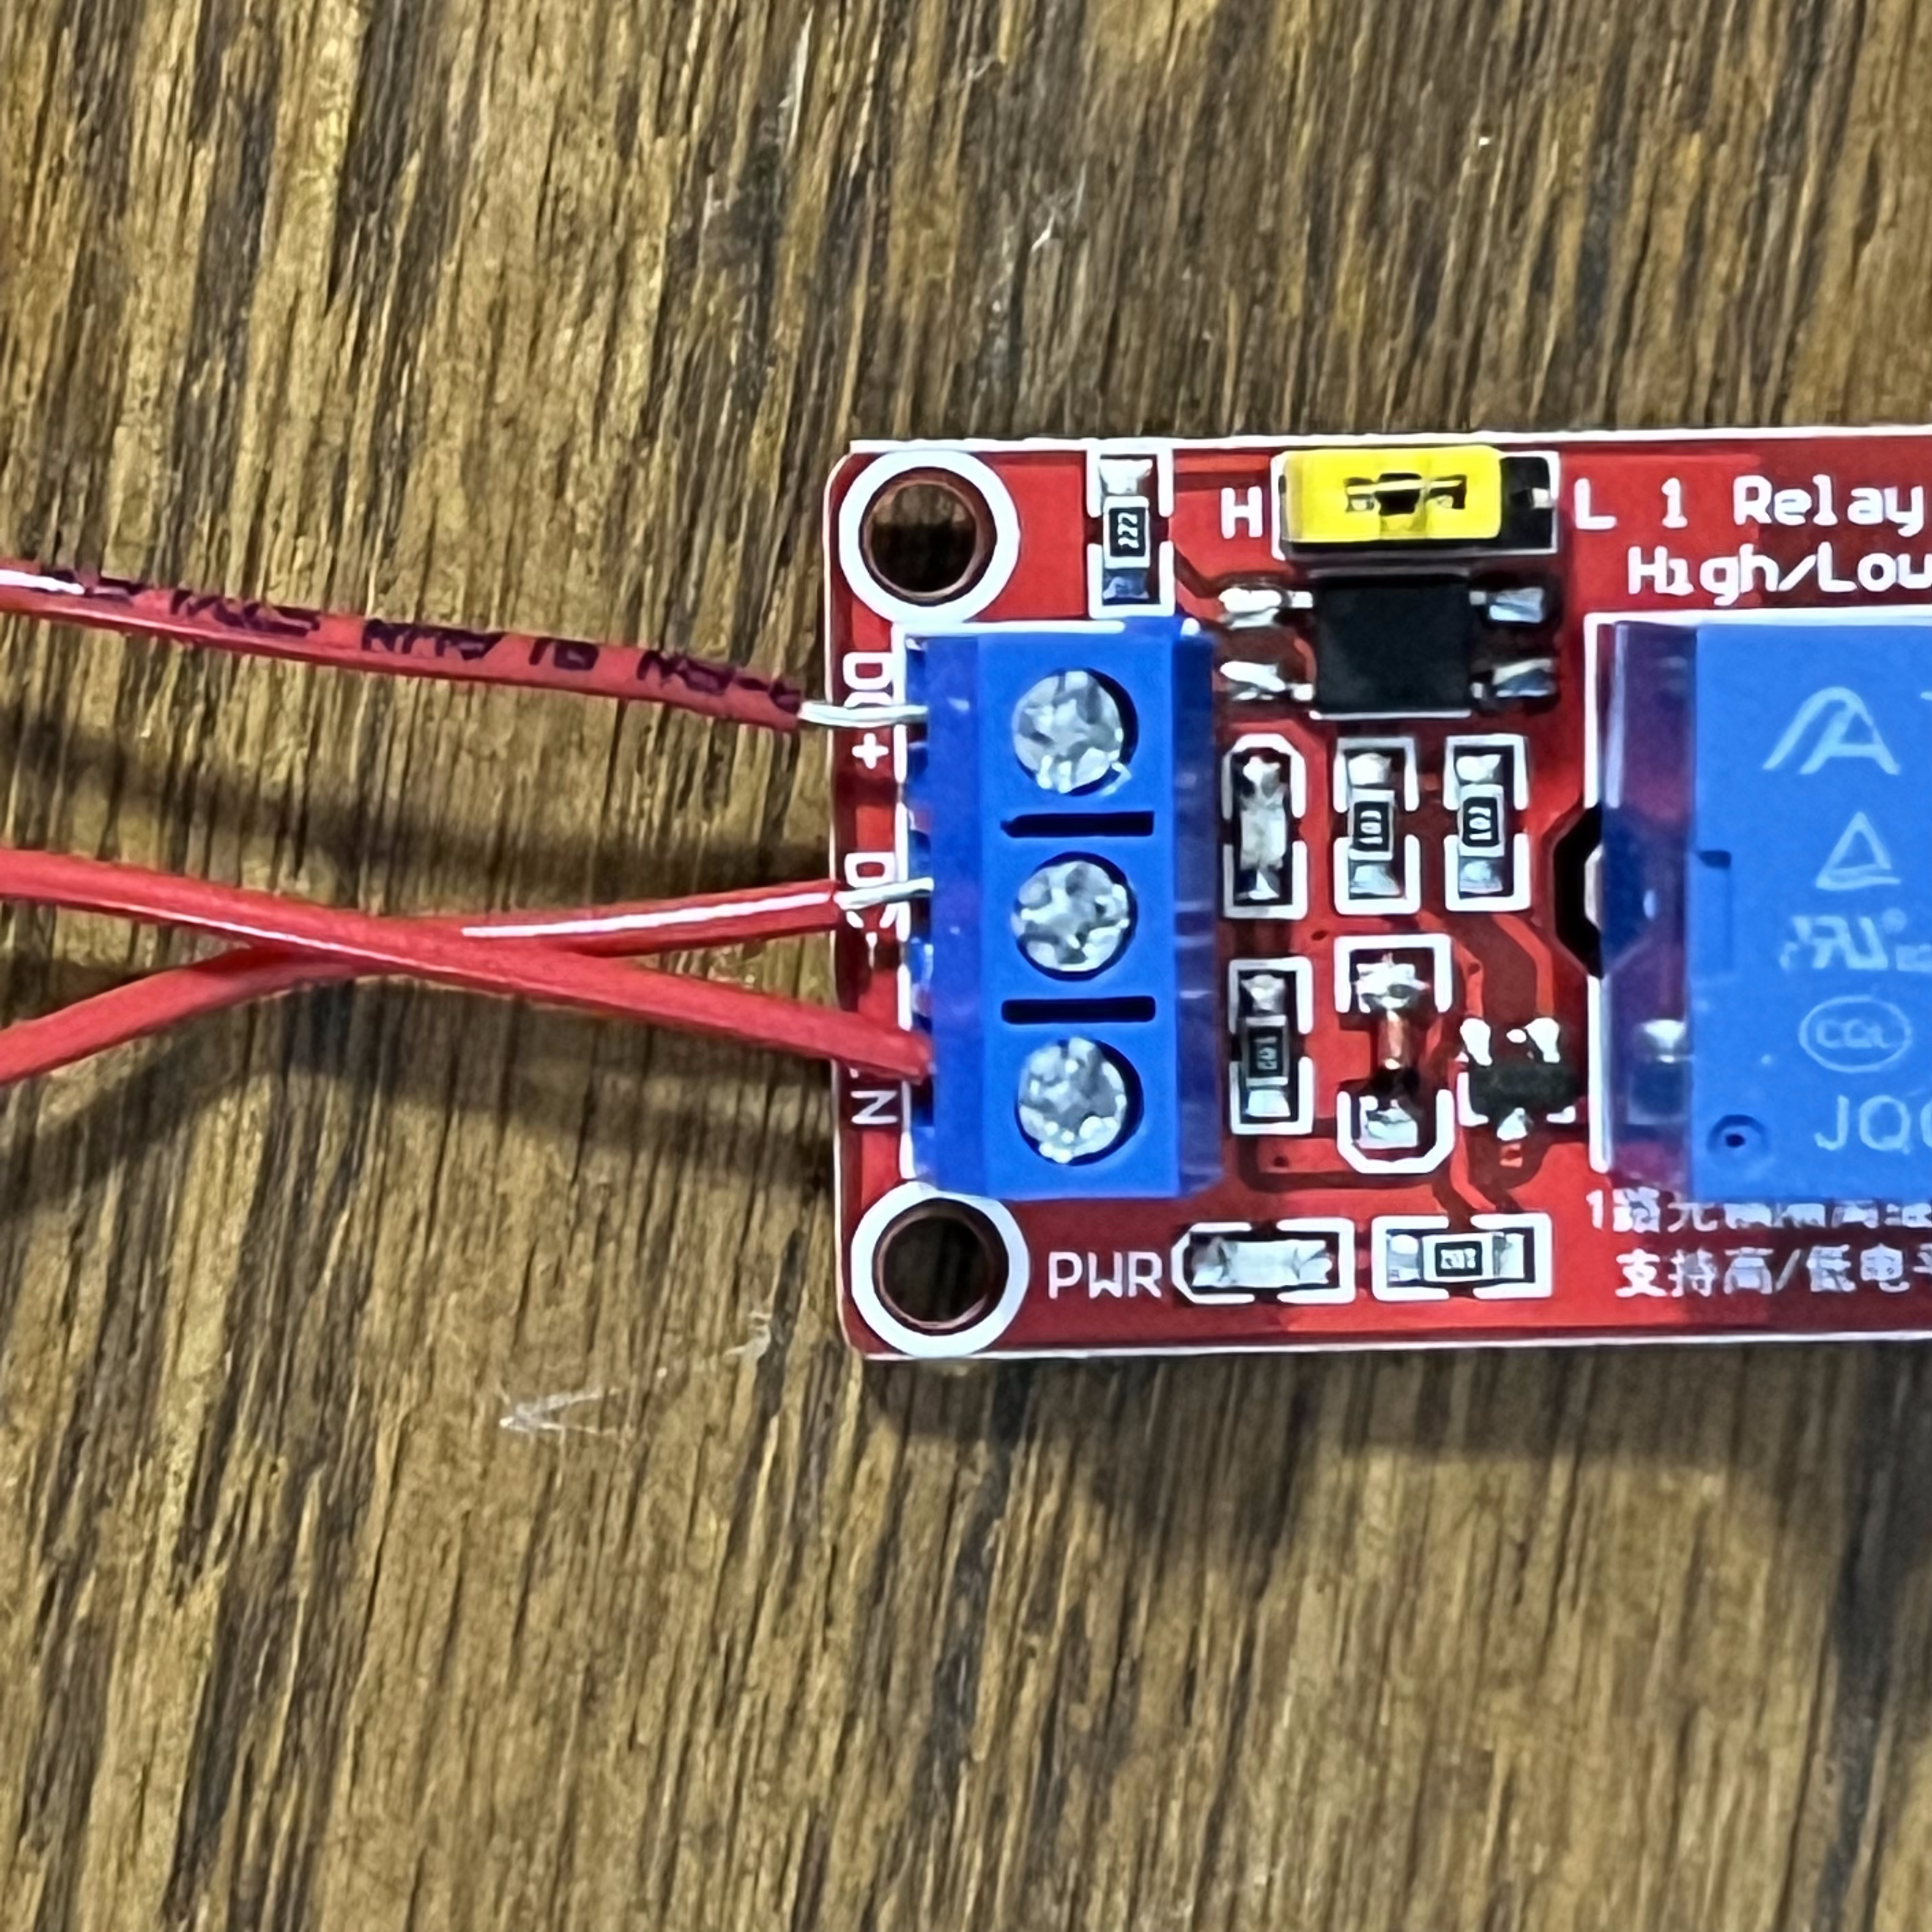
Fig 4. Relay input wires
Next, I attatched the heating pad and 12v power supply to the relay.
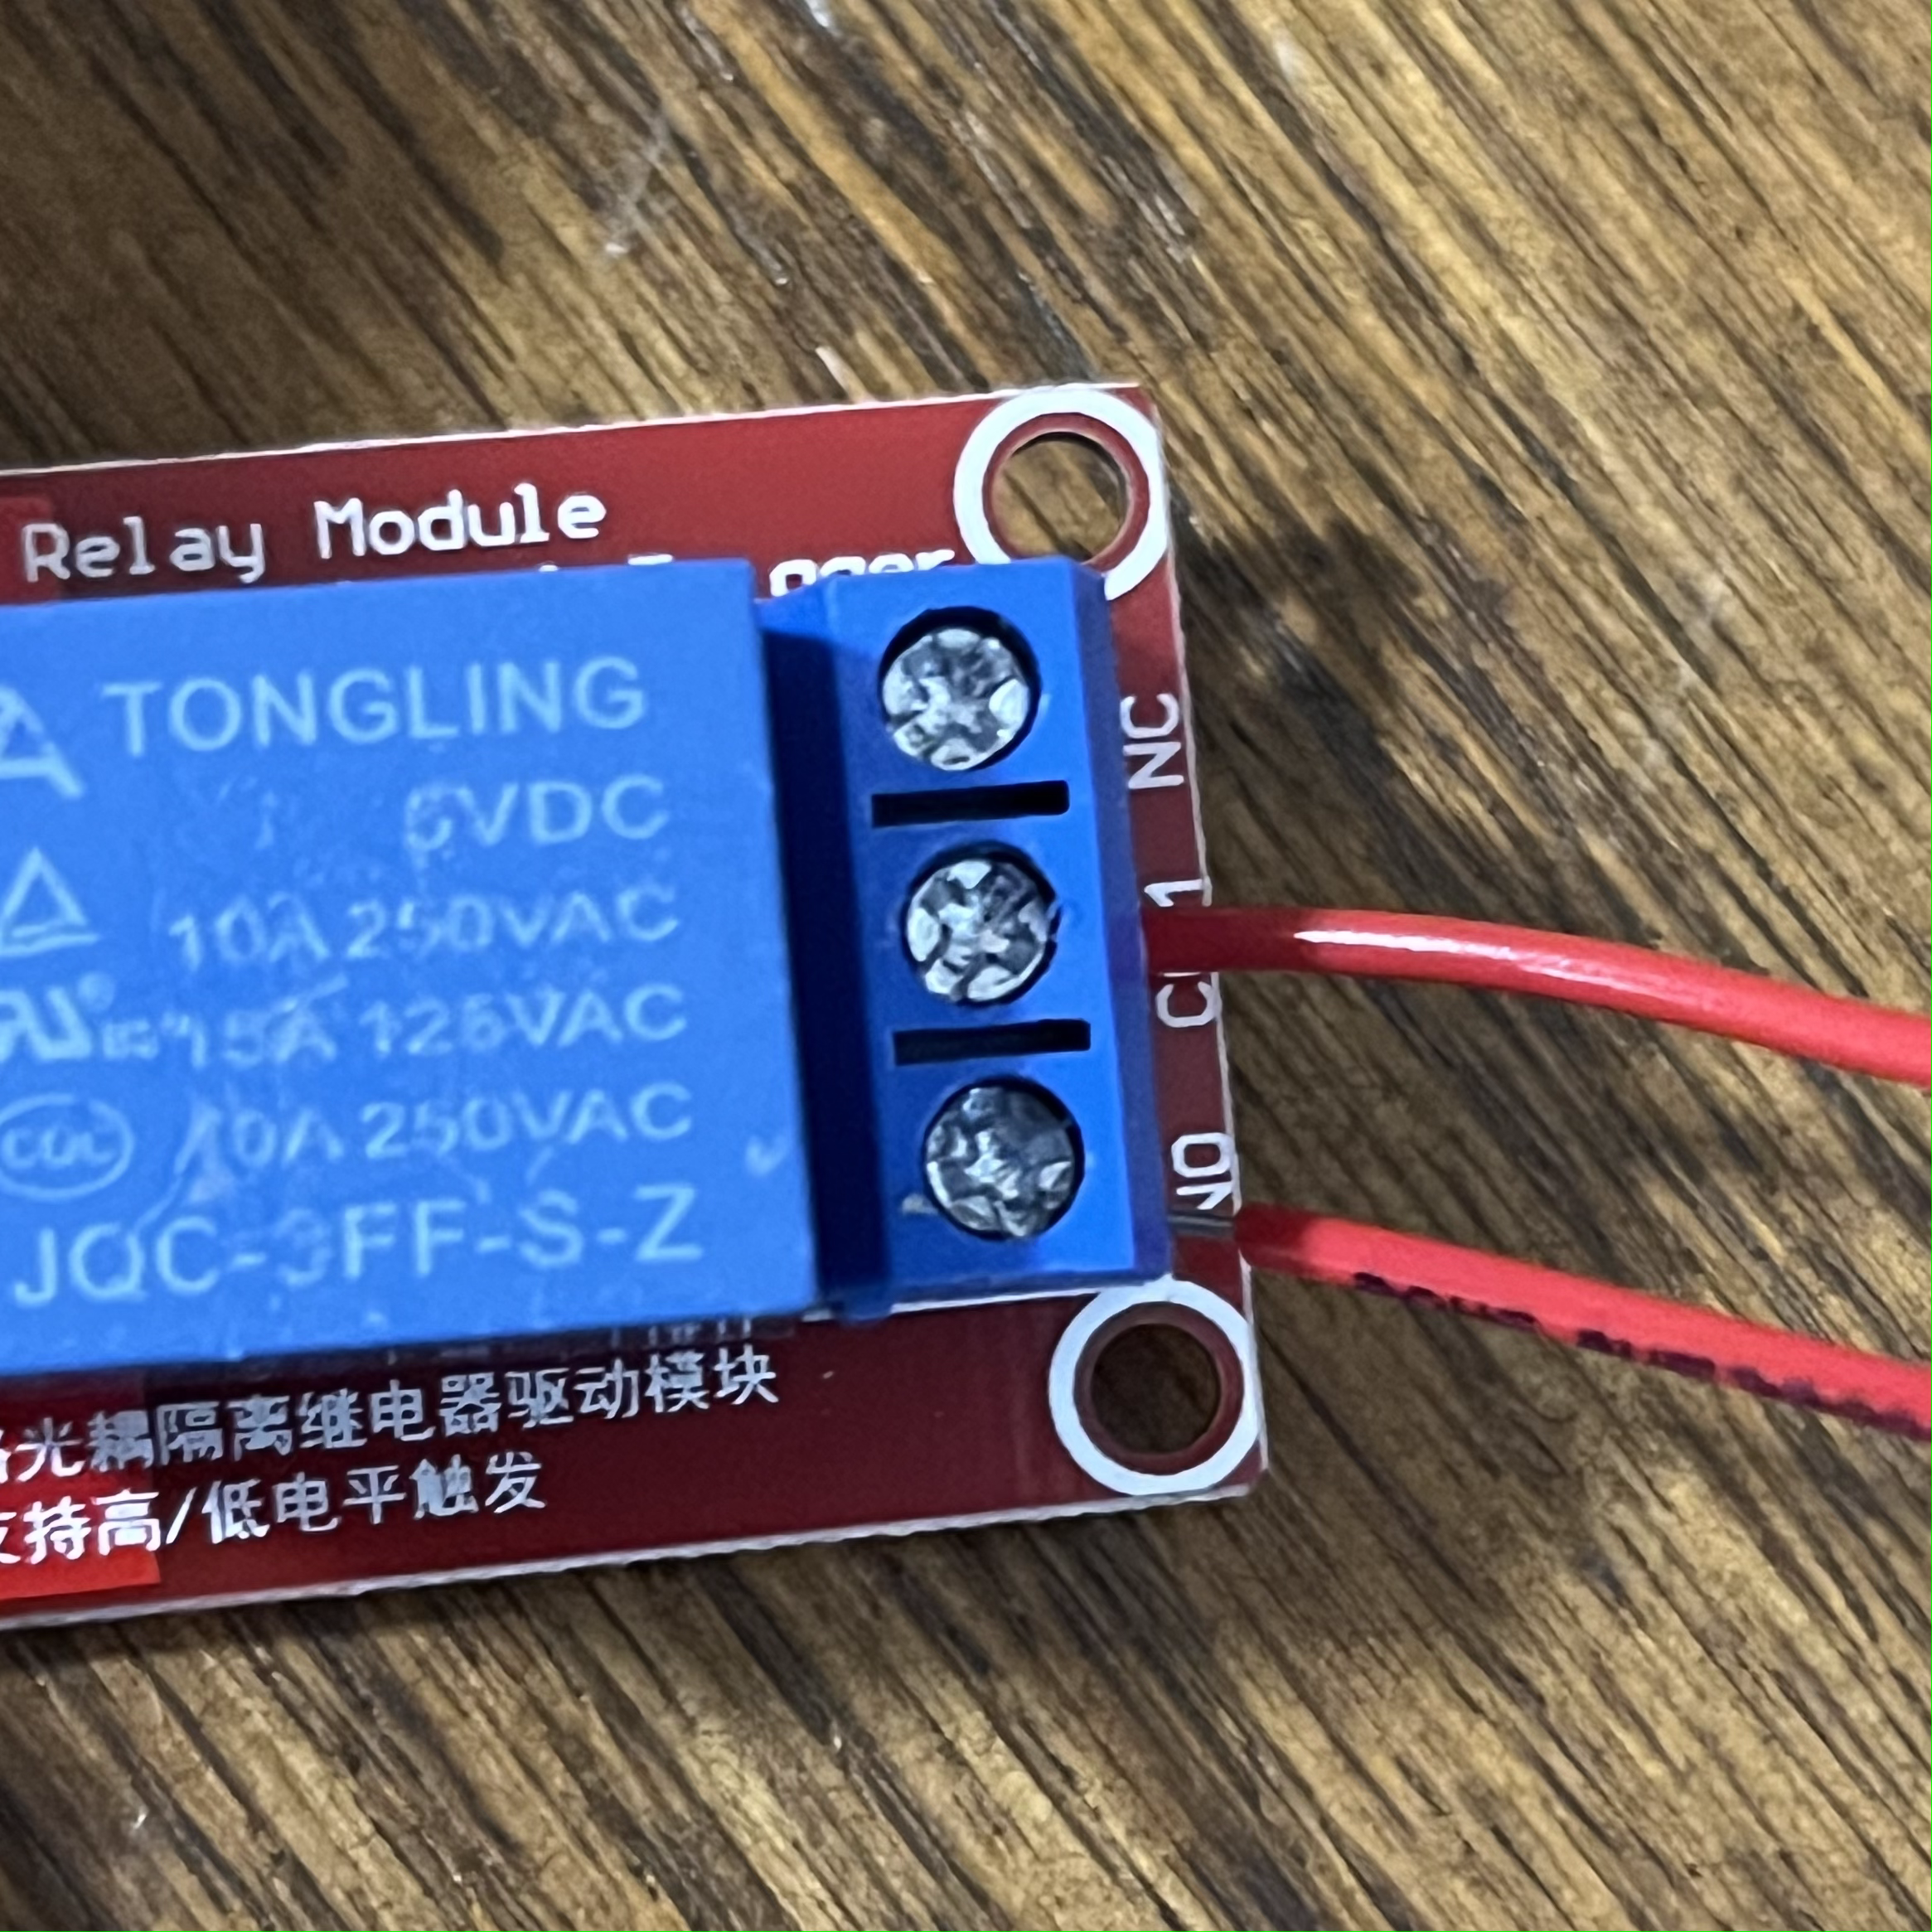
Fig 6. Relay output wires
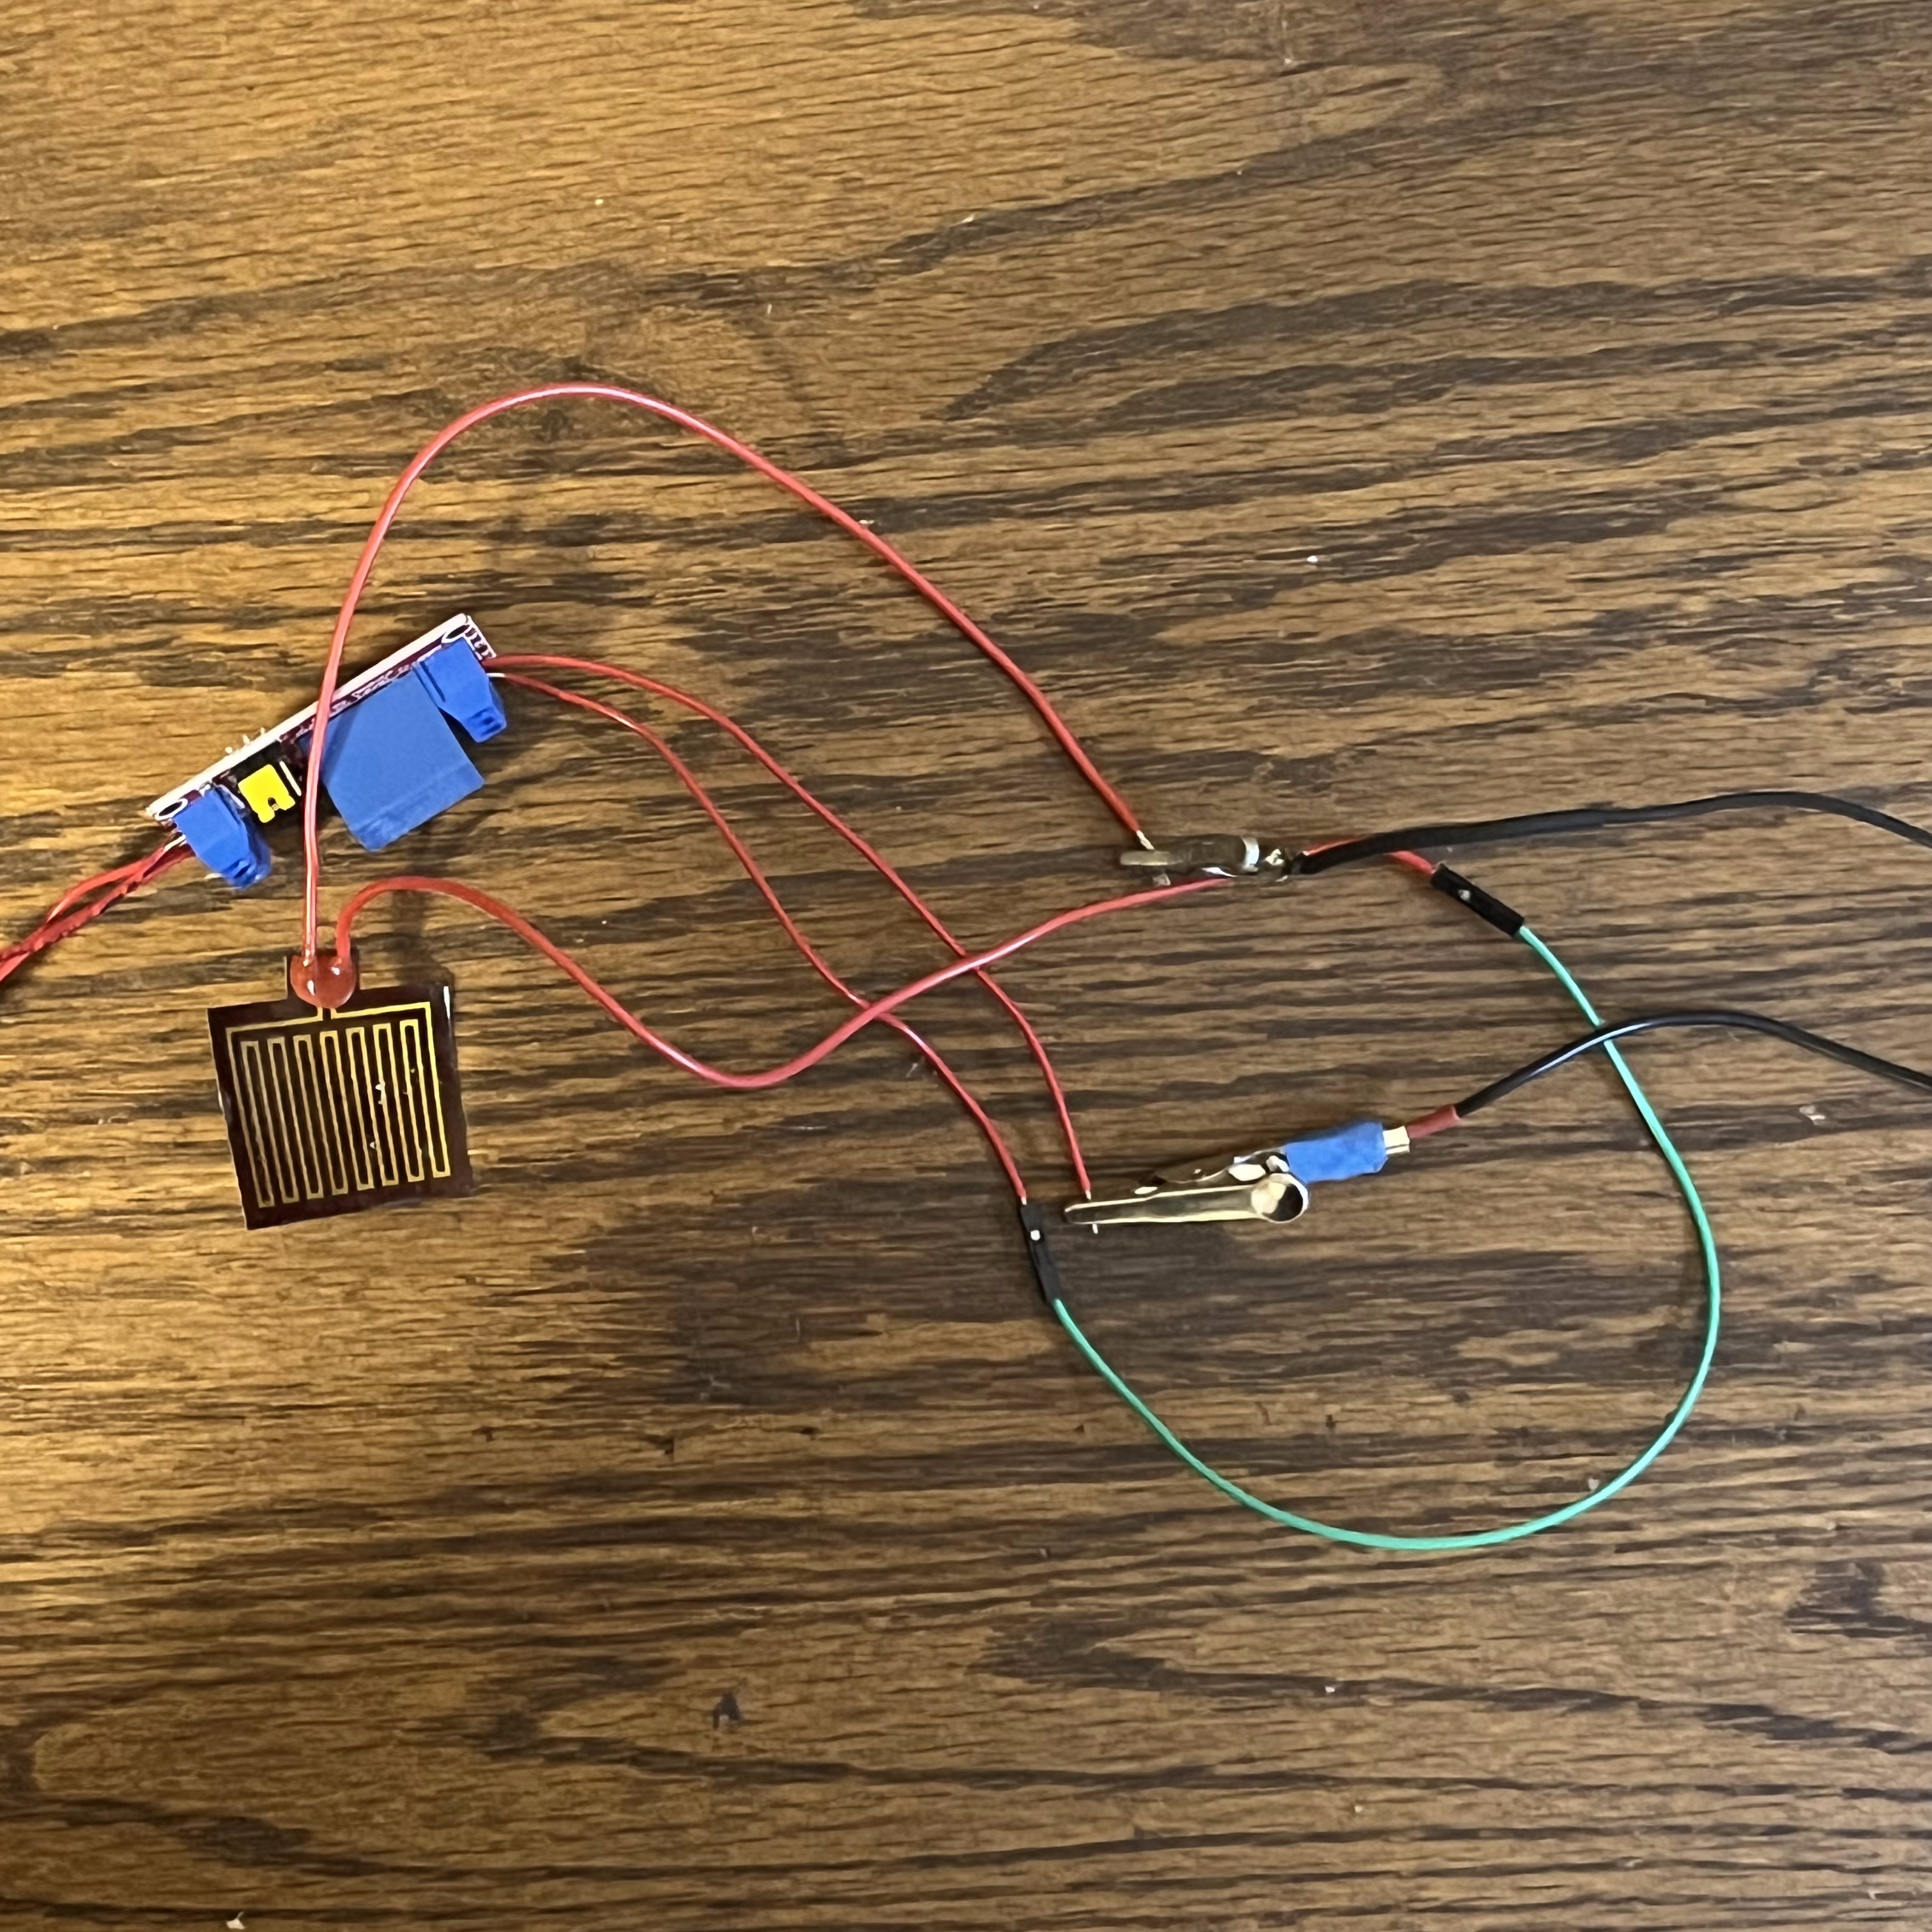
Fig 7. Wiring for the heating circuit
I then created a simple thermistor circuit. For more details, see my previous documentation about photoresistors.
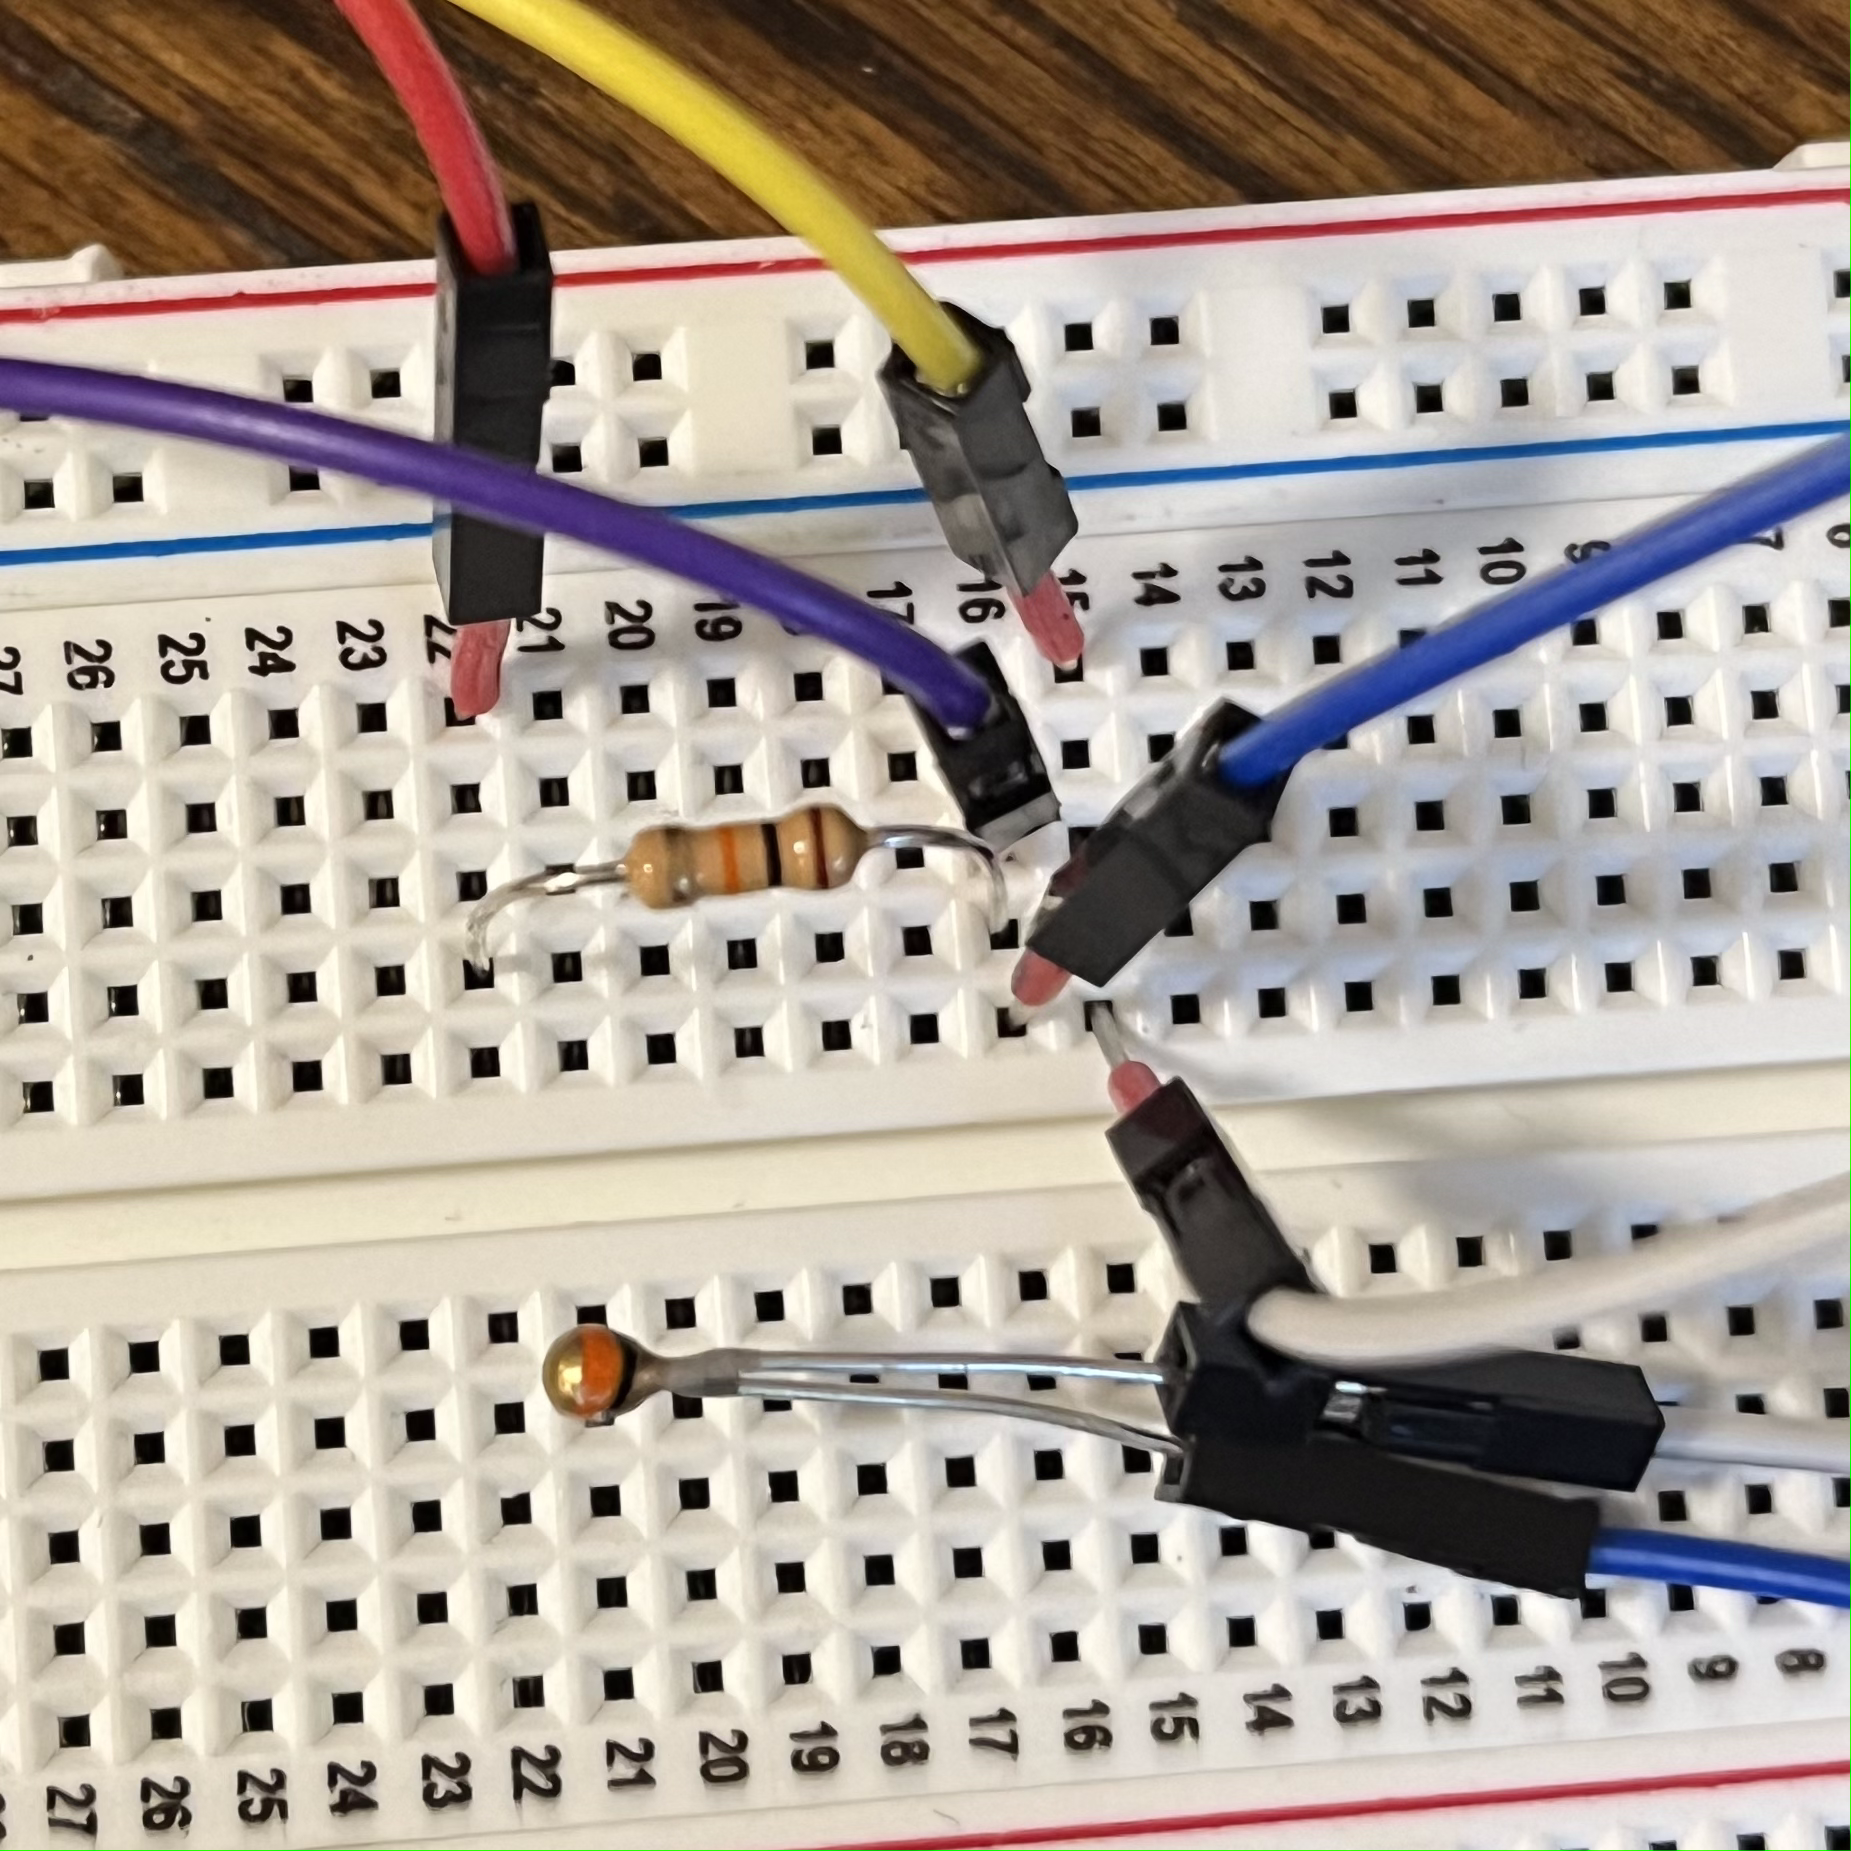
Fig 8. Thermistor circuit
Finally, I connected my thermistor to my heating pad using sticky tape.
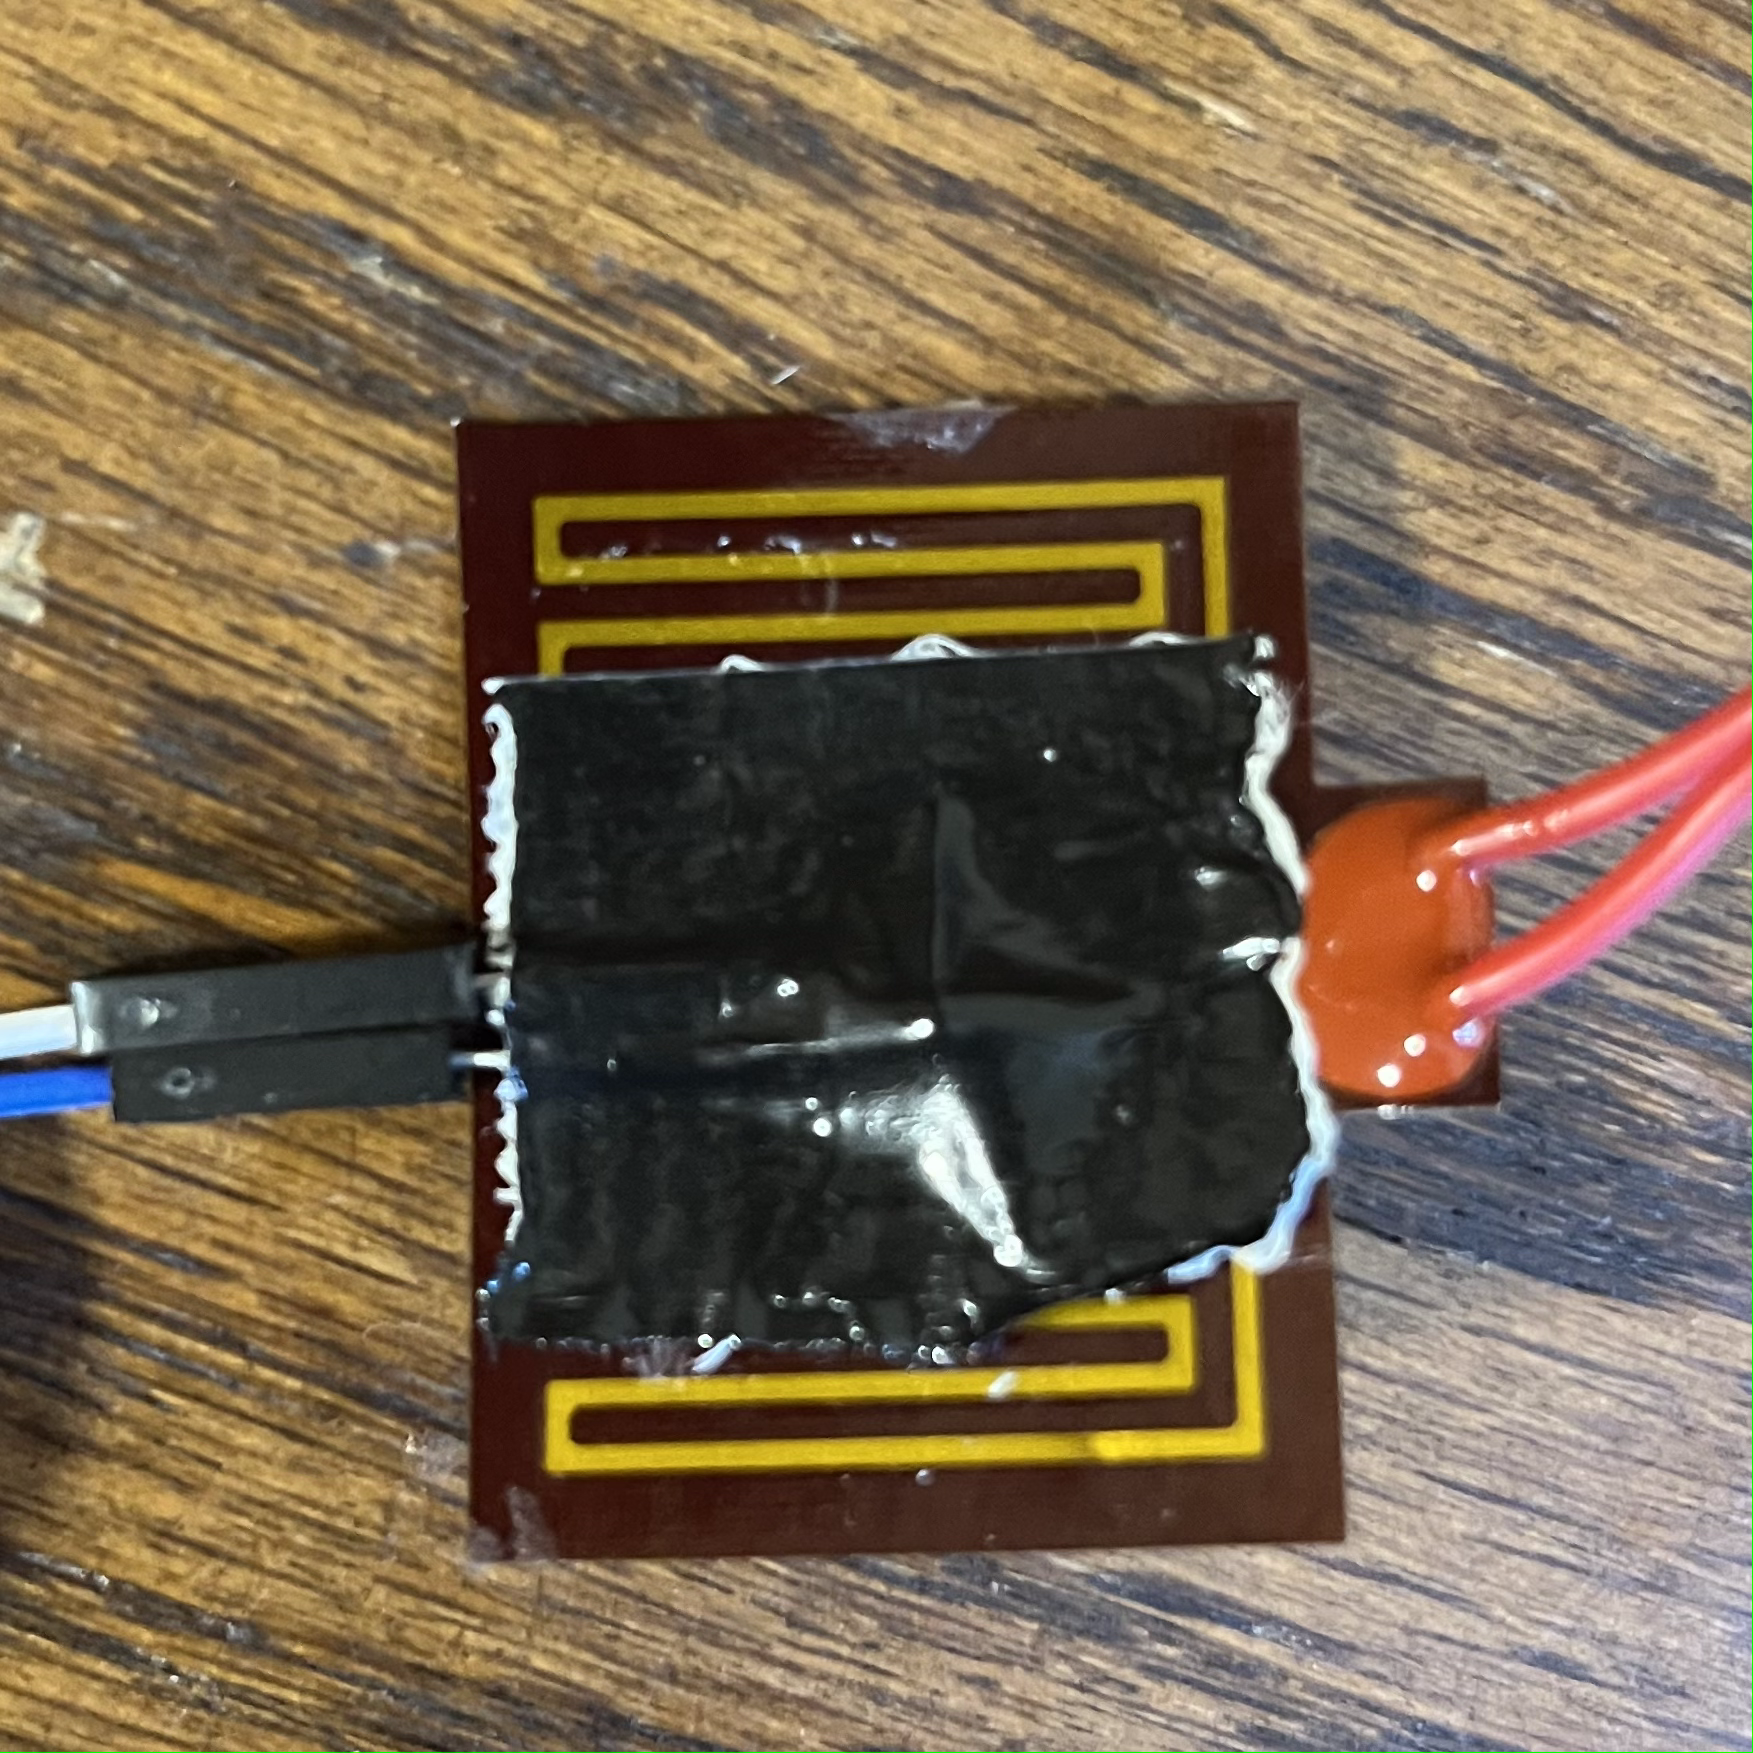
Fig 9. Connected thermistor
I then began writing the code required to get data from the sensor and use it to heat my heating pad.
Code:
As you can see, I created two classes; one class represented a thermistor and another represented the relay. I then instantiated an instance of each class and used the Read() functionality of the Thermistor class to get data to modulate the On() and Off() methods of the Relay class.
I began testing this and found that 4600-4700 was about room temperature, 4200-4300 was pleasantly warm, 3800-3900 was hot, and 3600- was unpleasantly hot. While I do not have specific temperatures for each of these bands, I am happy to say that my idea worked! Below is a graph of an 8 second interval of my heating pad running at 4250.
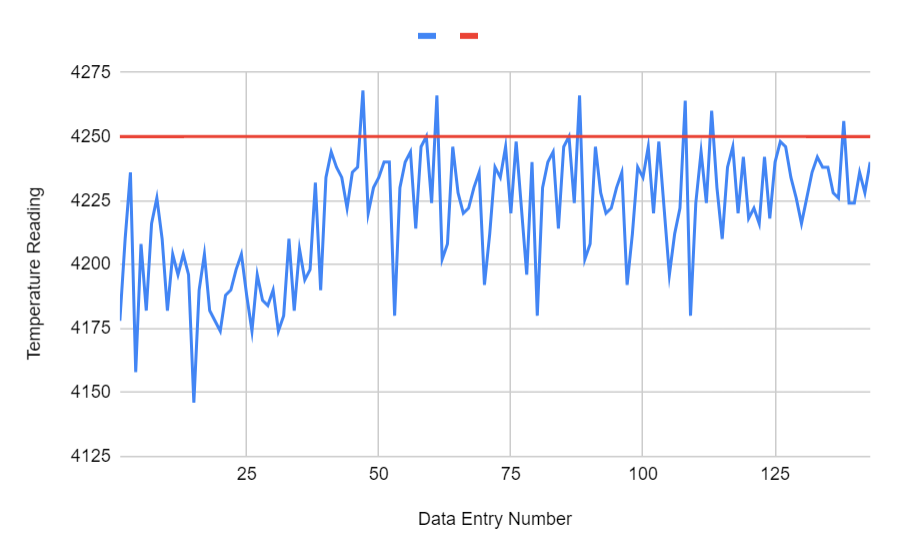
Fig 10. Collected data
As you can see, the data tends to be lower than my expected (red) value. I definitely think there is work to be done with regard to the algorithm used to modulate the temperature. Regardless, you can see the temperature stays fairly consistent.
Part 2 - Oscilloscope Readings
Unfortunately, neither my heating pad nor my relay have a duty cycle, which means I won't see any nice square waves. However, I still saw a lot of very interesting things when using the oscilloscope.
First, I looked at the datasheet for both pieces to see if there was anything I should look for. While I didn't find anything specific, there was a lot of information under the "Performance" section of the relay datasheet that can help explain some of the behaviors I see later.
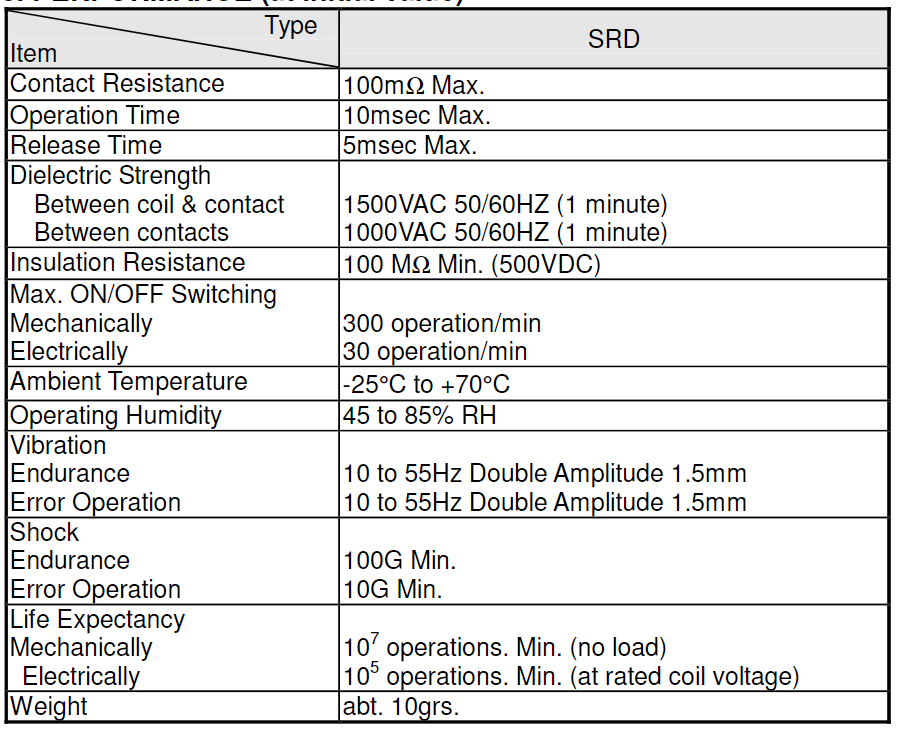
Fig 11. Relay datasheet (Performance)
I then attatched the oscilloscope to my project and paused it when there was a wave. These waves appeared directly after the relay switched from one state to another.
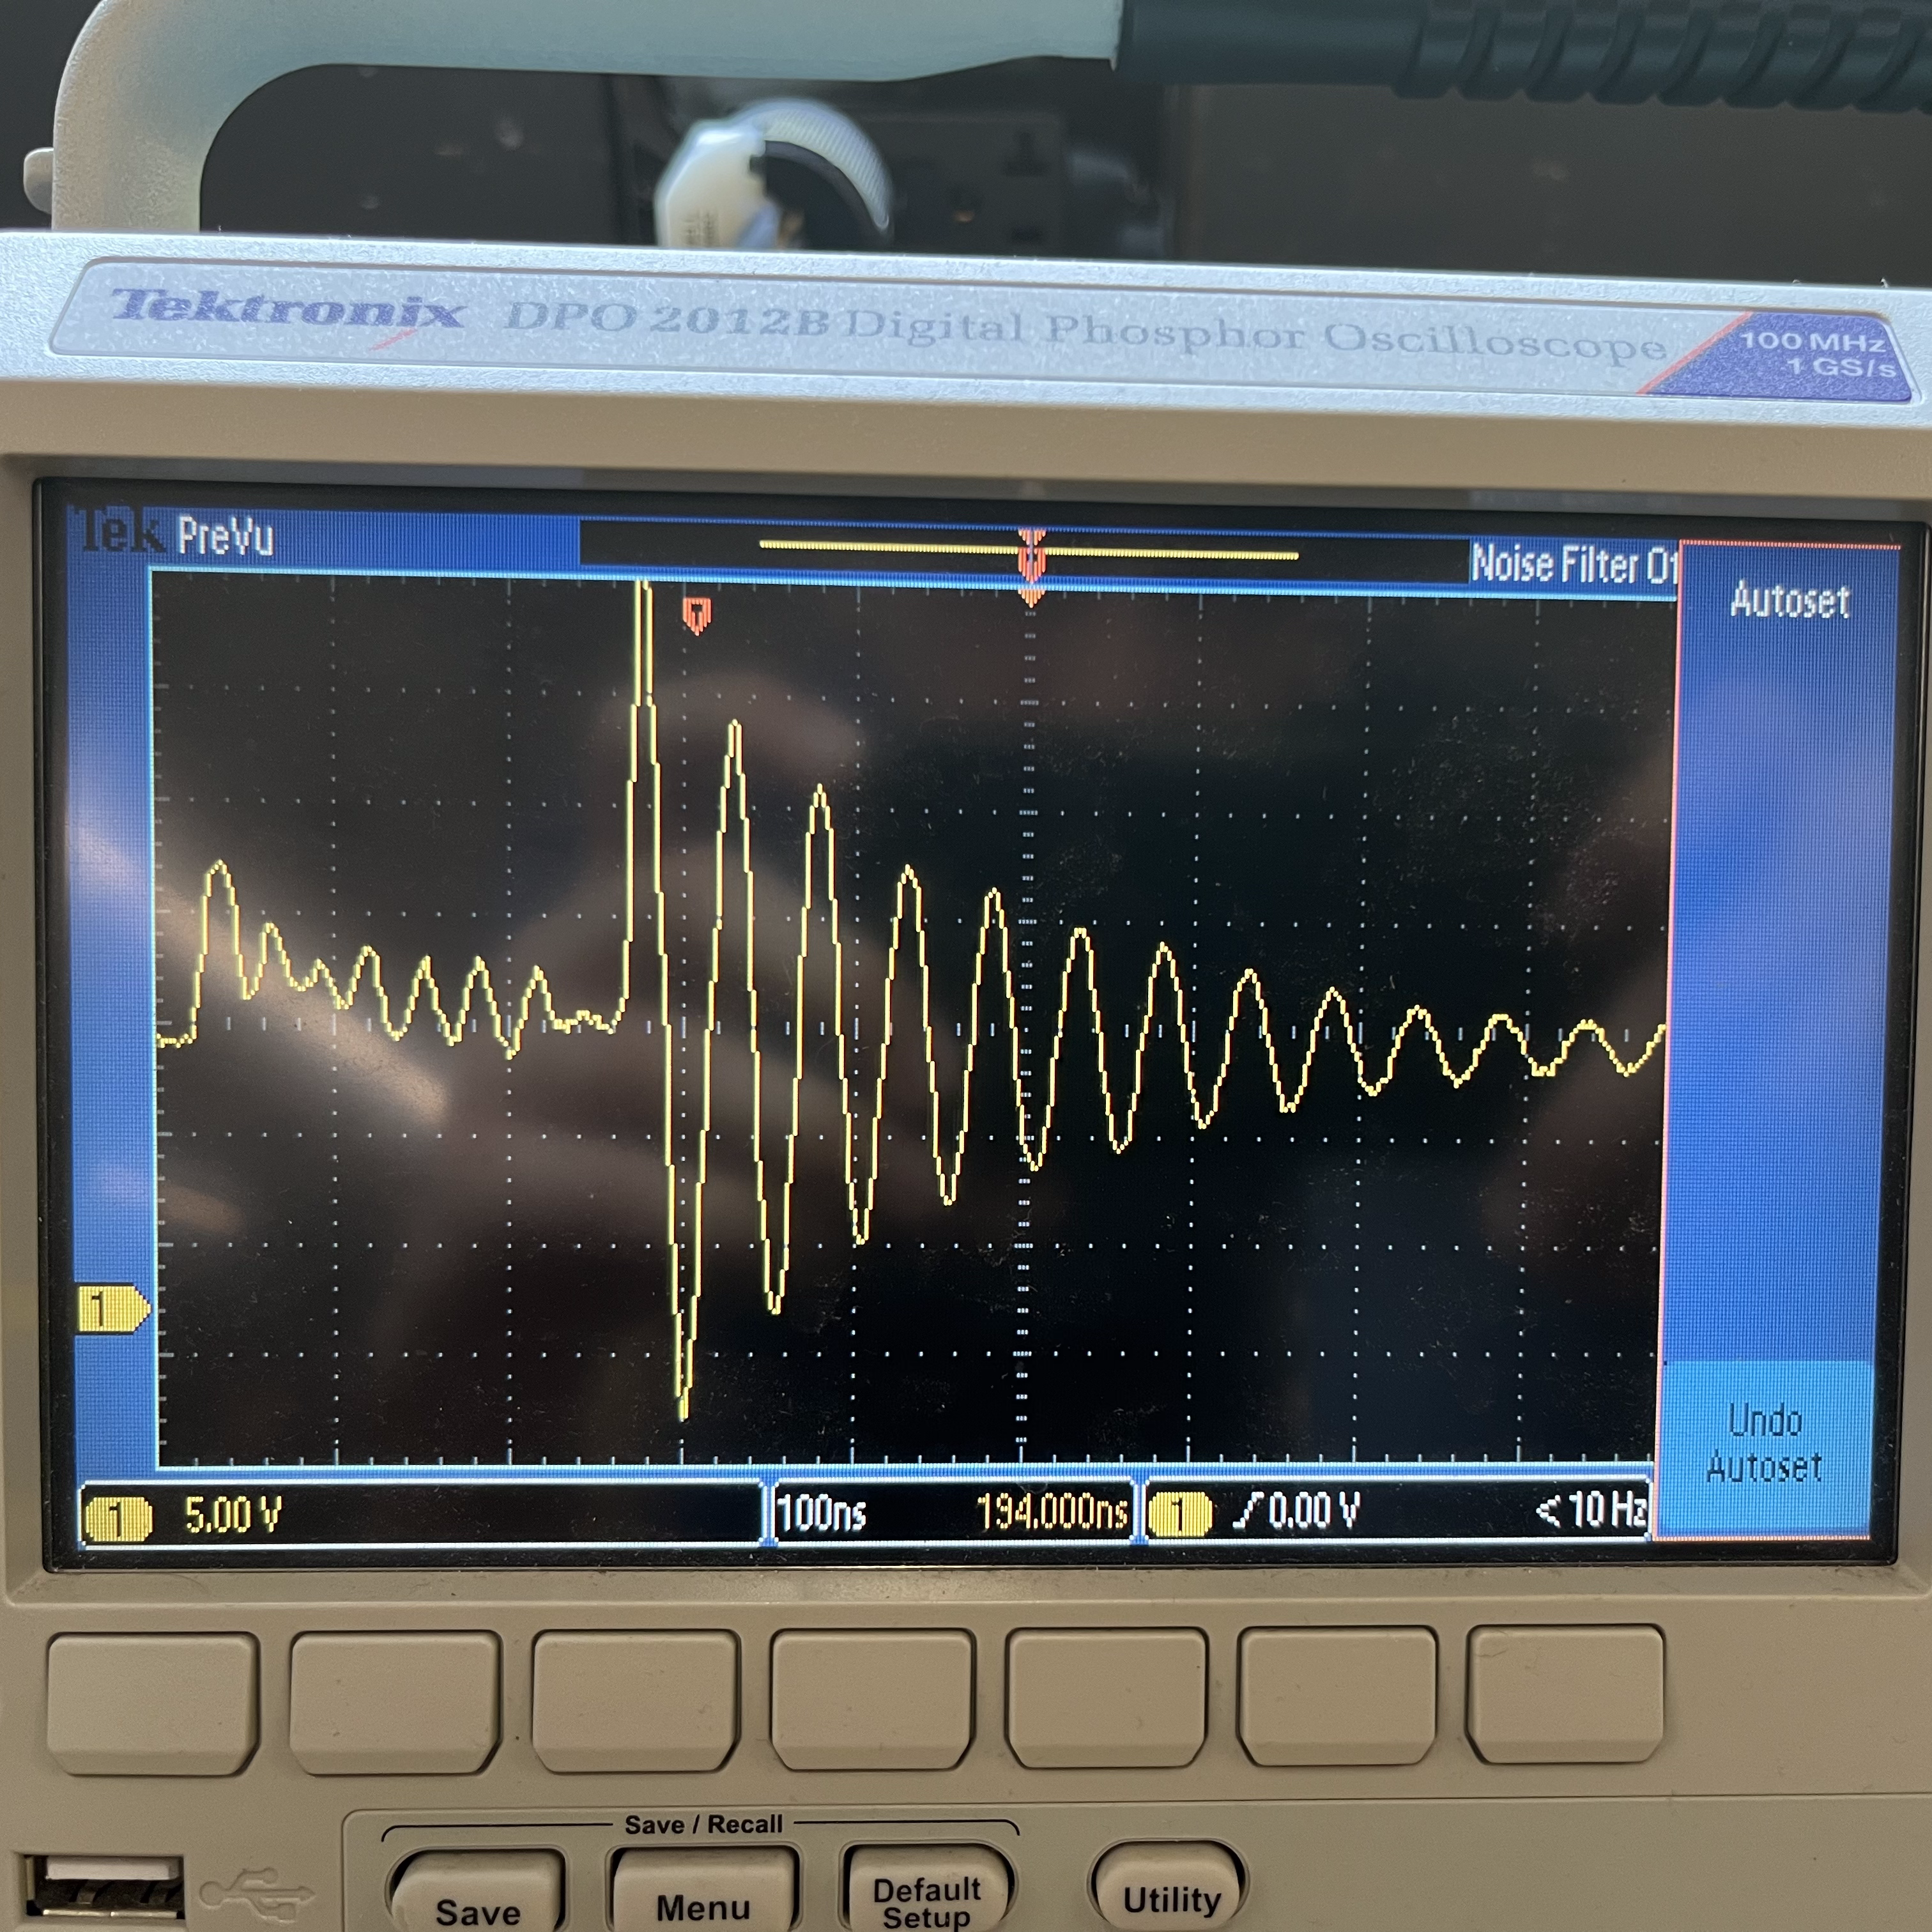
Fig 12. Oscilloscope readings (single)
As you can see, this wave looks a lot like a damped harmonic graph. Instead of a square wave, there appears to be a sine wave, although one with decreasing amplitude. There is also some strange noise coming before the wave.
This reading was positioned such that there were 5v intervals and 100ns between each time interval.
In a second reading, you can see the complete waveform of a single state switch. There is a small wave that resembles the damped harmonic wave from earlier, two strong spikes and falls, and then one large damped harmonic wave. The voltage interval is the same but the time interval is now 2 microseconds.
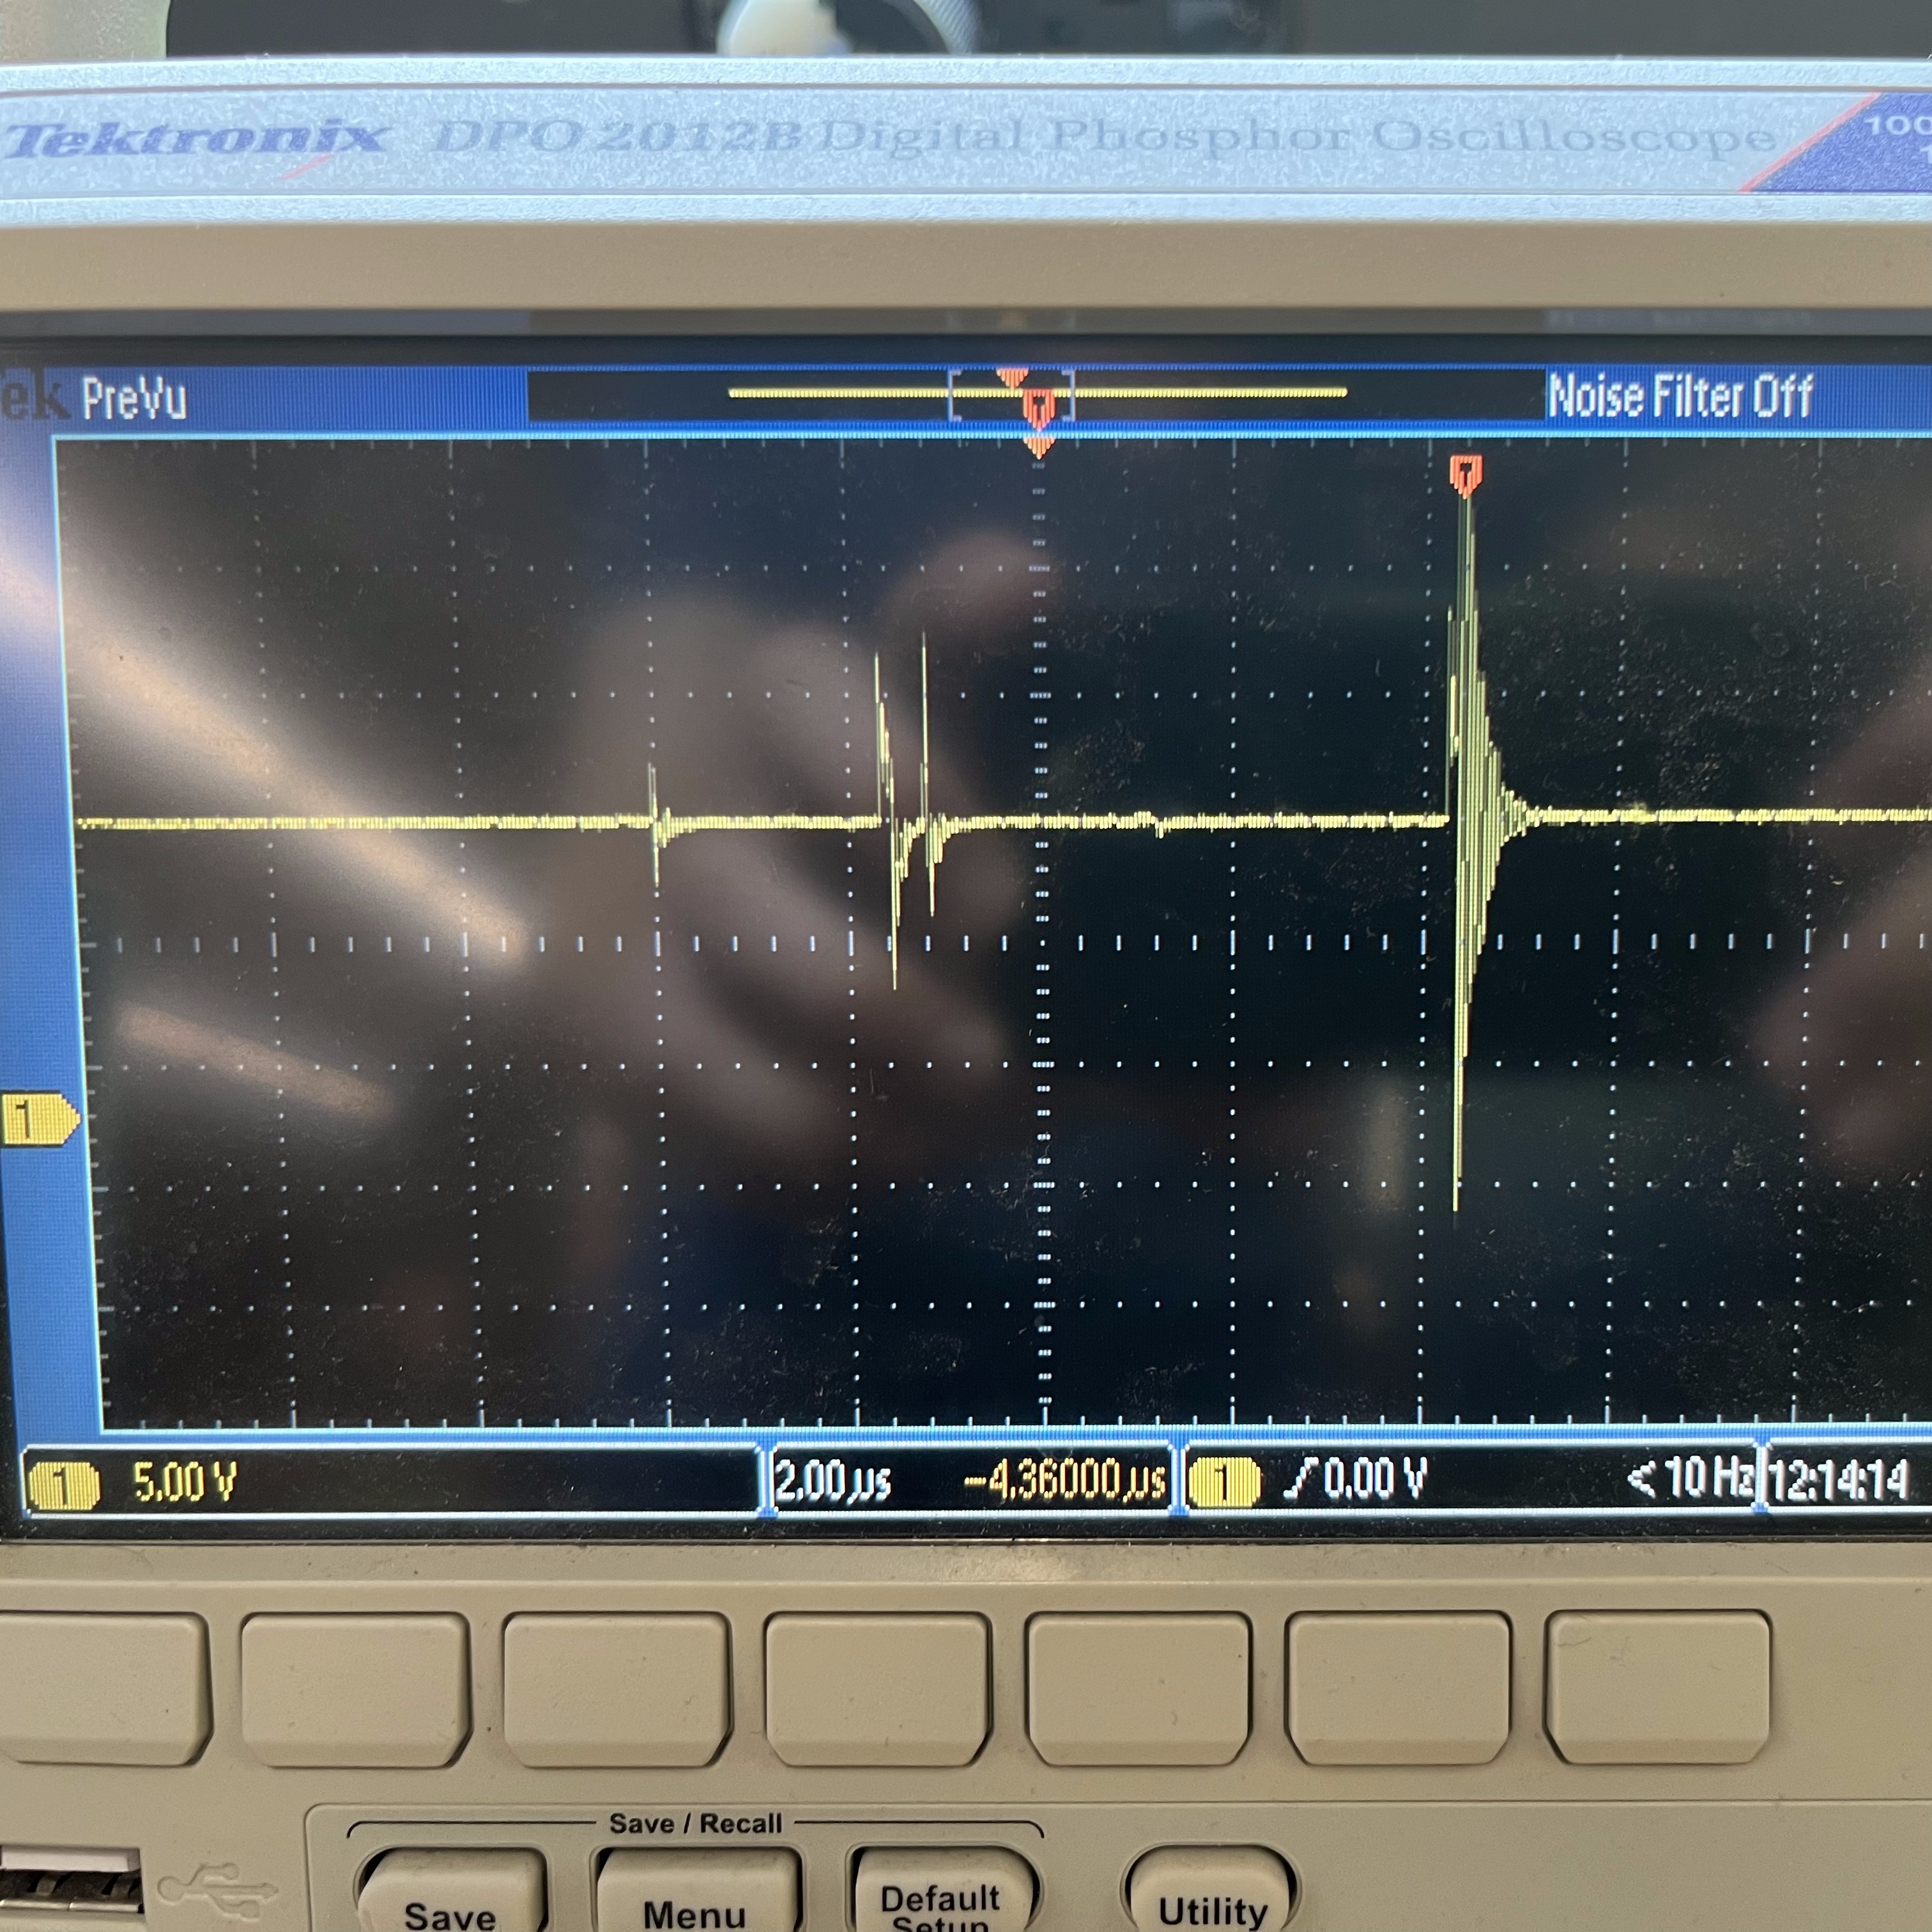
Fig 13. Oscilloscope readings (full)
This was extremely weird to me, but Ibrahim suggested that this reading might have something to do with the relay's protocol. The relay's datasheet mentions vibration, although I'm not sure if that is what is responsible for these waveforms.
Concluding Remarks
This project was significantly shorter than a lot of my other projects, but clearly built on a lot of the knowledge I gained from previous lessons. I had to use an input device, Arduino classes, basic circuitry, and output devices to solve this problem. I also had to graph the data I recieved which gave me great insight into how my project was working. I would definitely like the opportunity to use the oscilloscope with a more "ideal" candidate in the future in order to see the perfect square waves that I was anticipating.
Files Mentioned in this Document
Heating Pad (.INO)